Data is a key weapon in the insurance industry’s battle with climate change
Global warming and population shifts are resulting in increasingly severe and costly disasters, but the tools insurers need to innovate and adapt are at hand

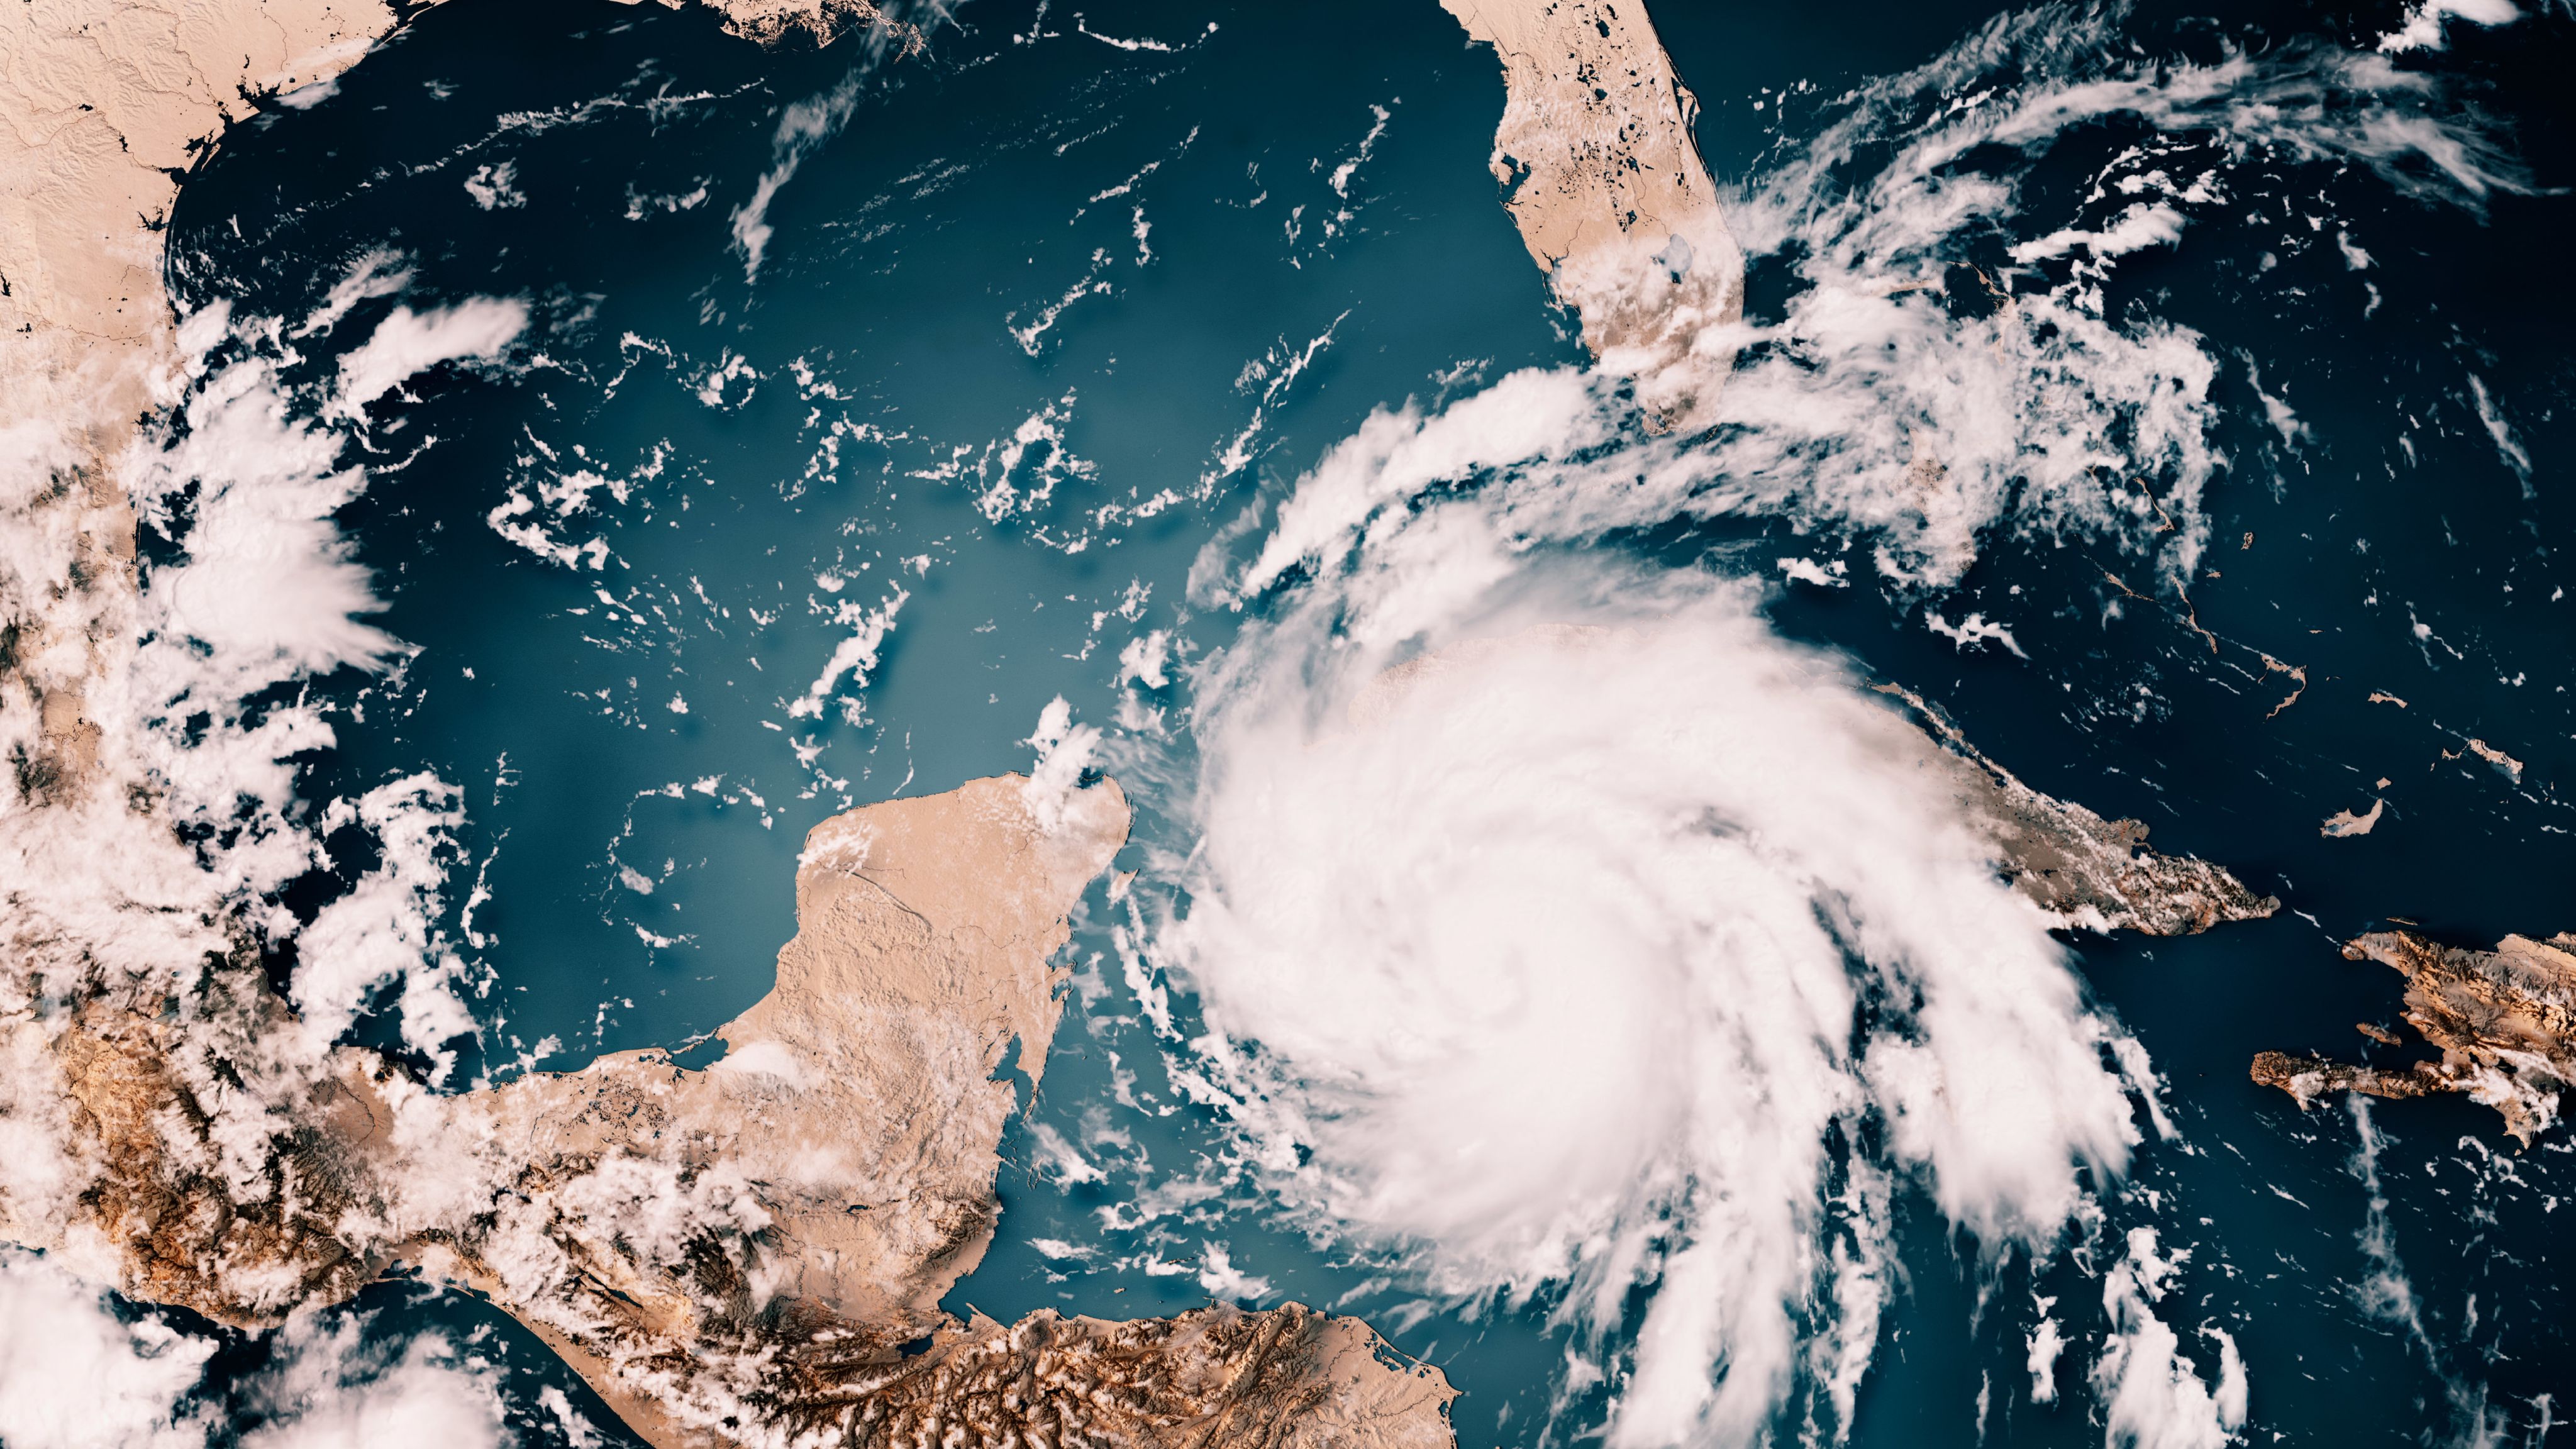
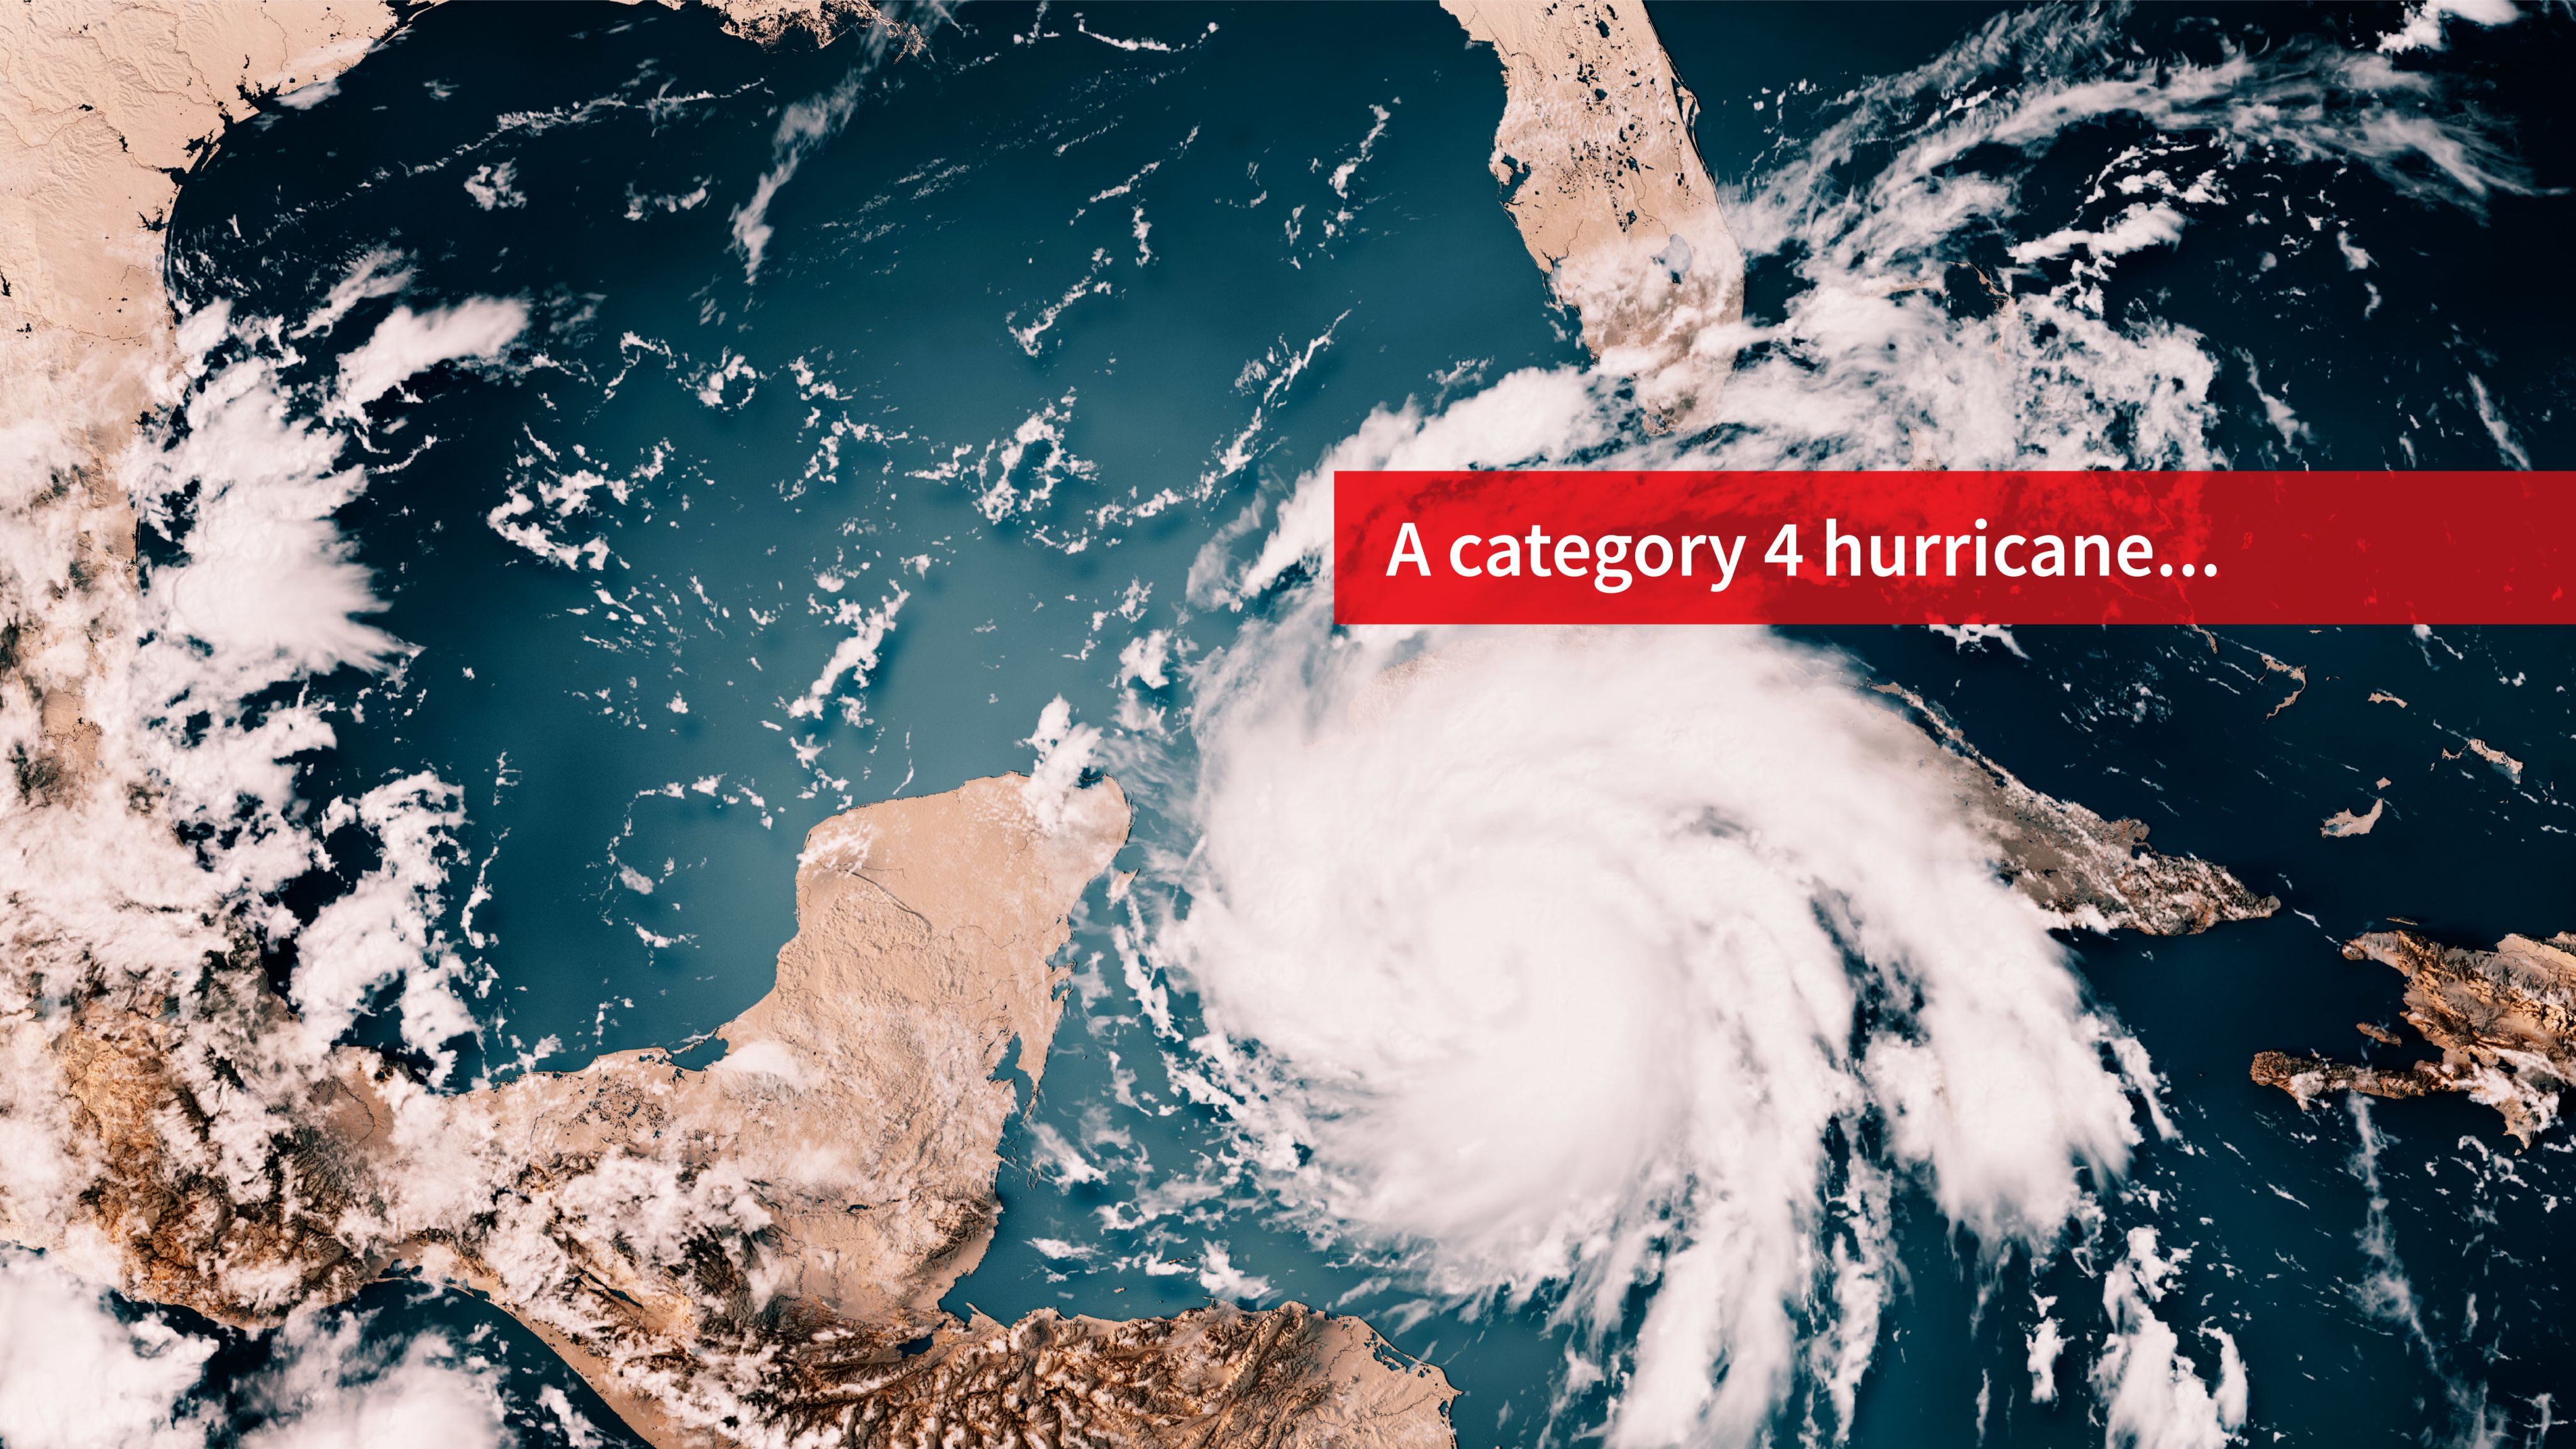
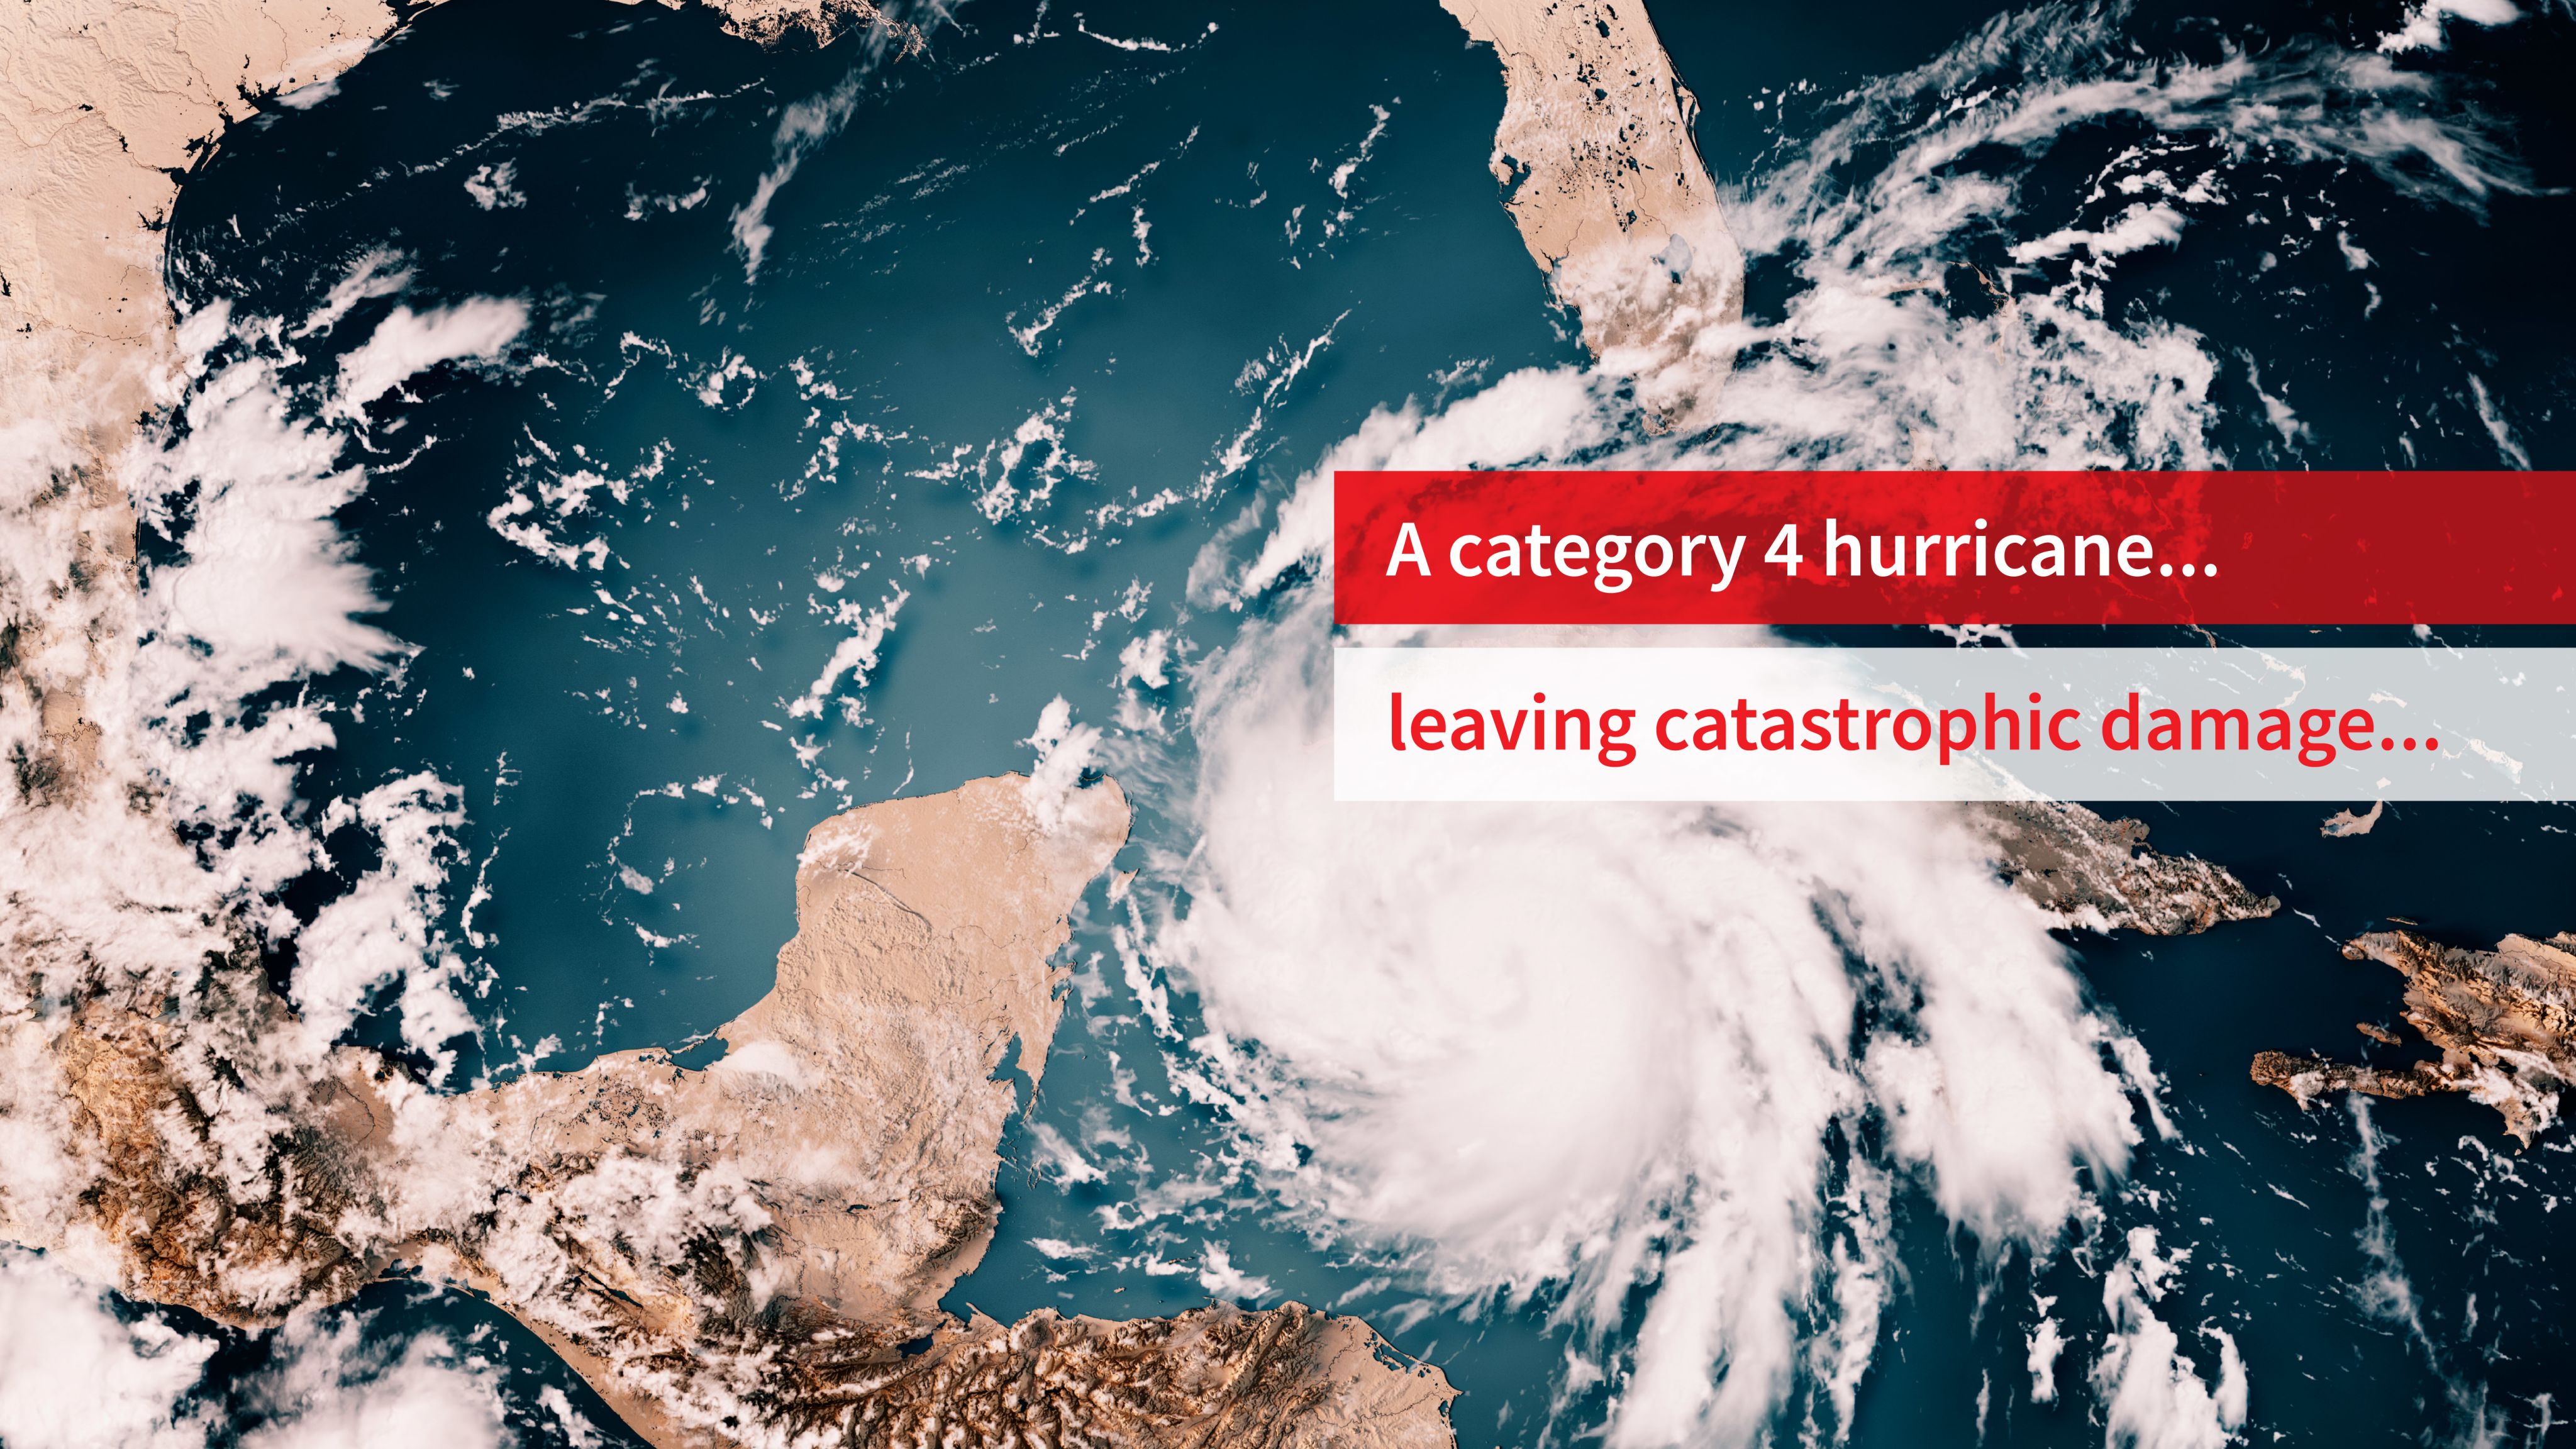
At just after 3pm on the afternoon of September 28, 2022, Hurricane Ian slammed into the coast of southwest Florida. With sustained winds of 150mph, the Category 4 hurricane tore through Lee County, leaving a trail of destruction in its wake.
“It was five or six hours of pure madness,” a resident of Fort Myers Beach, one of the areas that bore the brunt of the storm surge, later told the Washington Post.1
The cost of that madness was catastrophic. The National Hurricane Center2 reported that 156 people in the U.S. died, while damage to property and infrastructure was also devastating. In Lee County alone, 52,514 structures were impacted, of which 5,369 were destroyed.
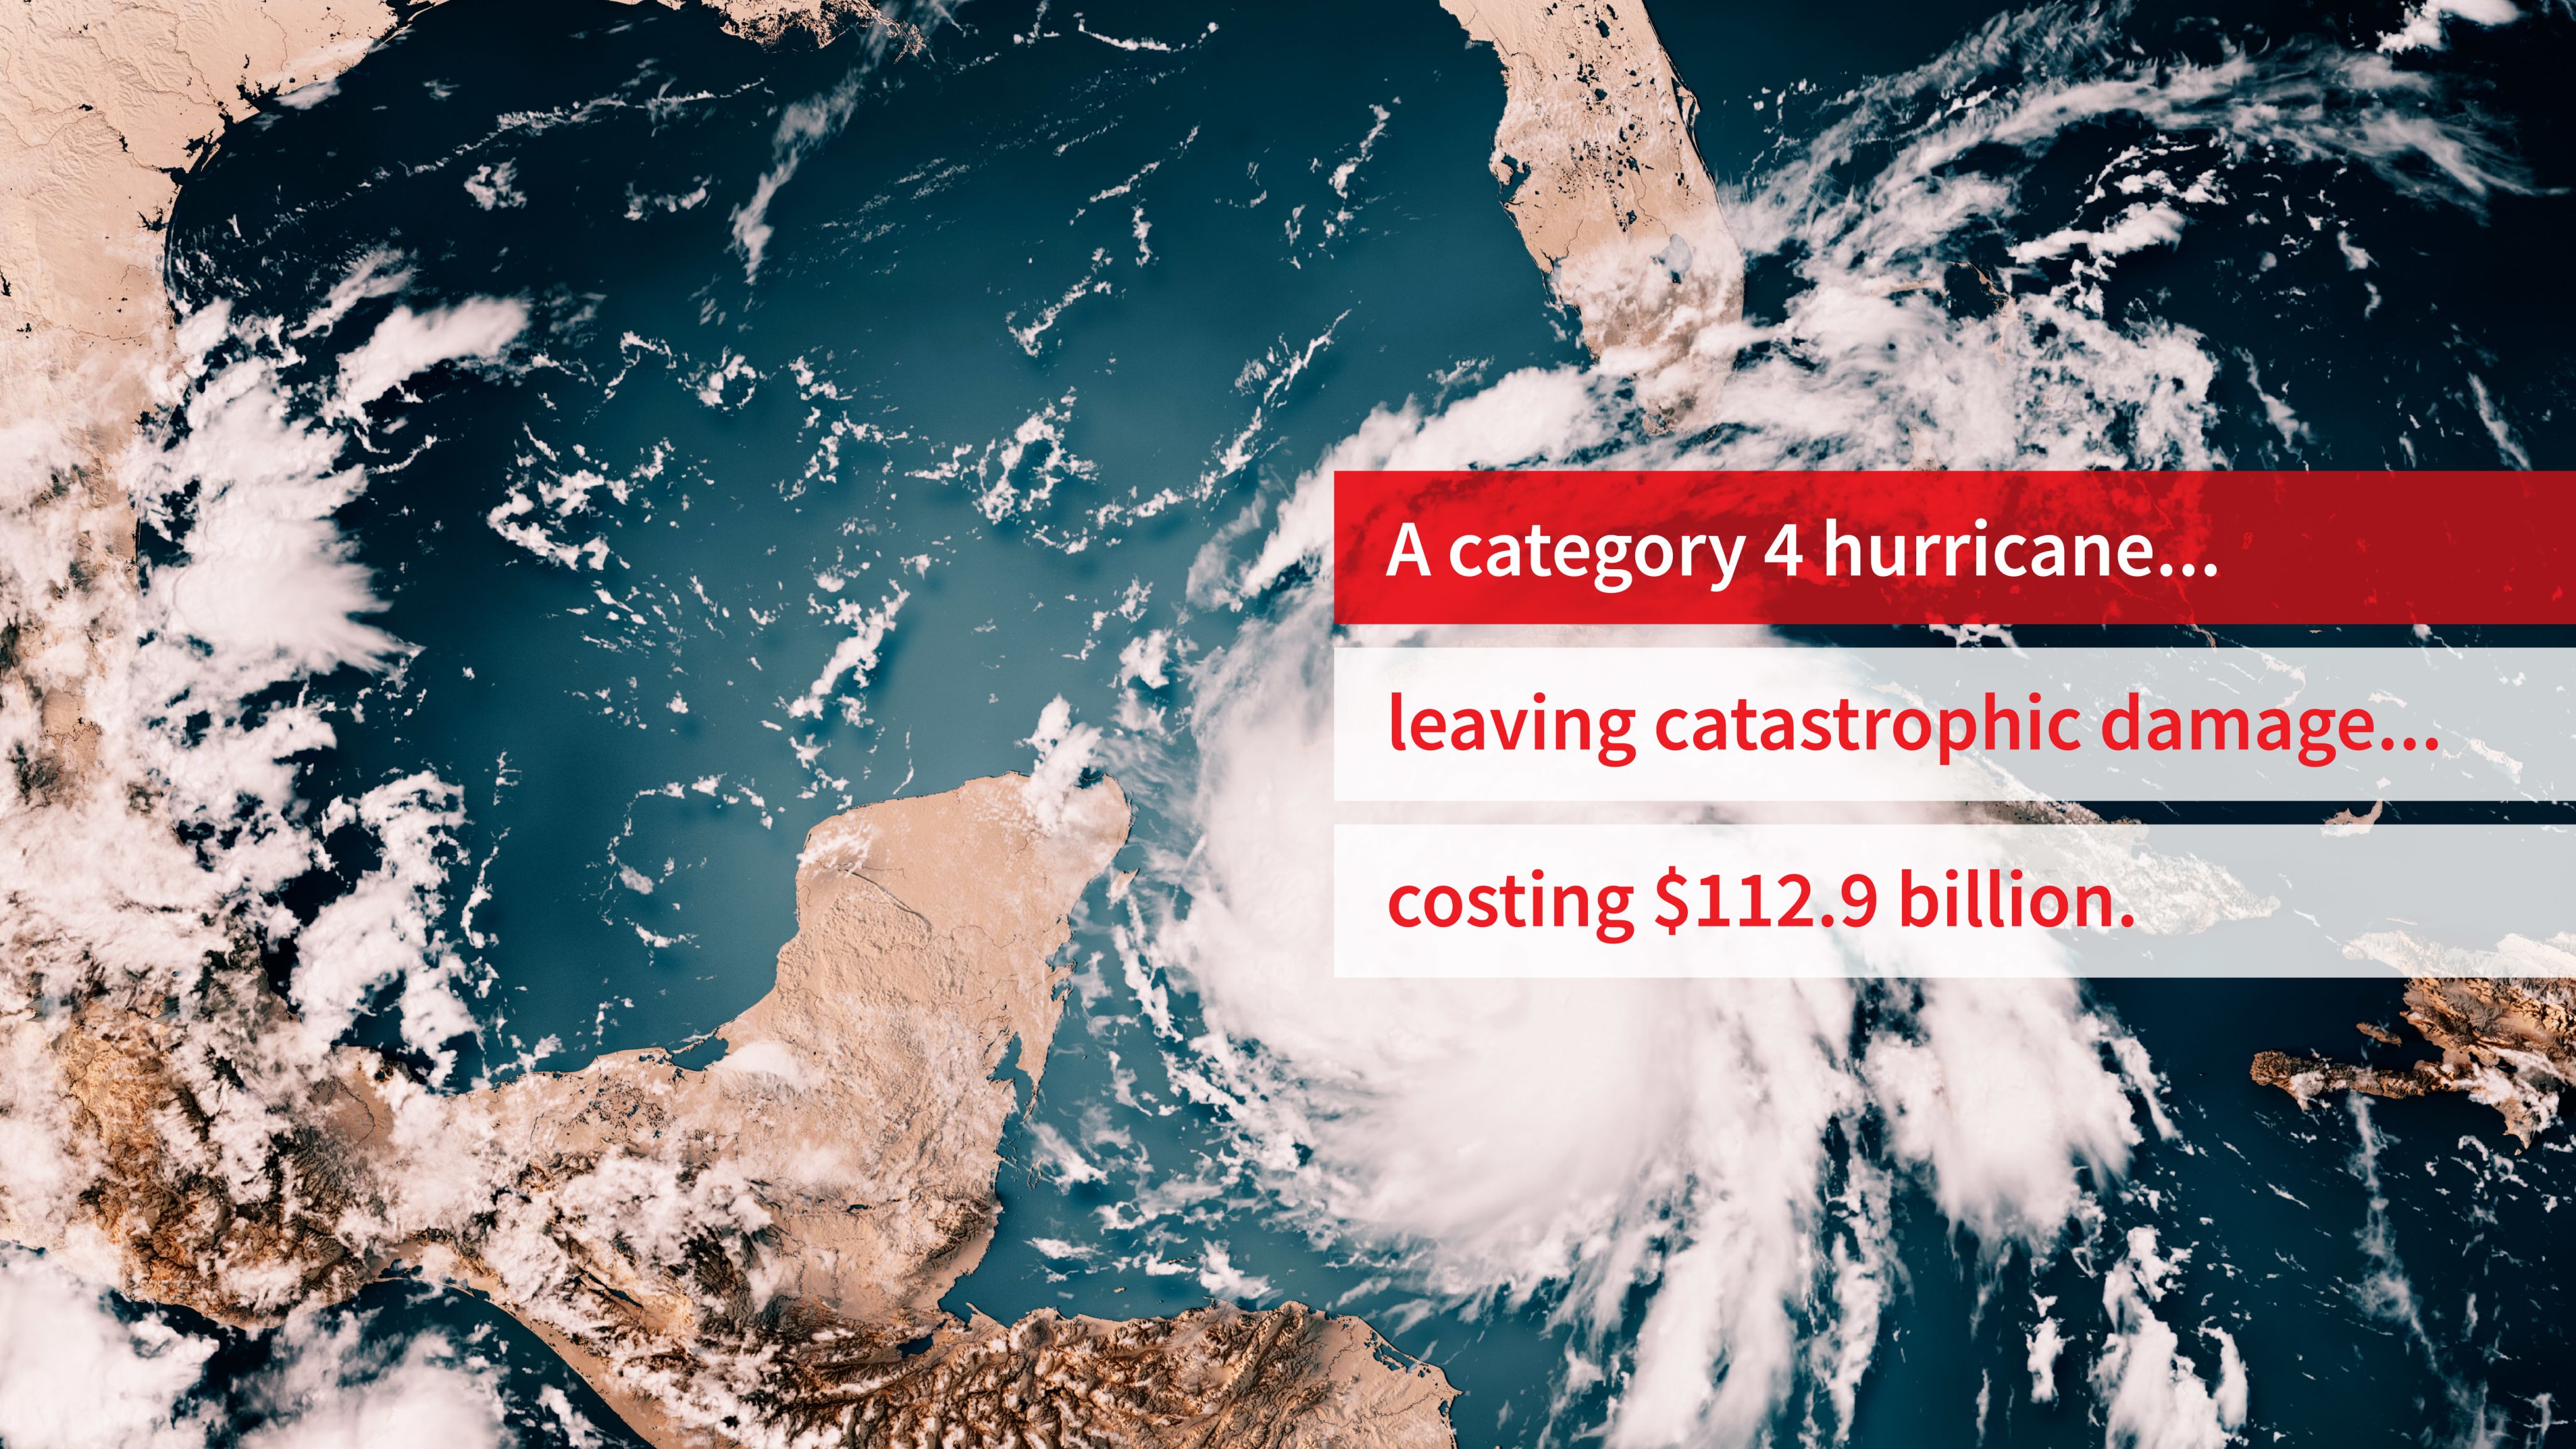
The National Oceanic and Atmospheric Administration (NOAA) ultimately estimated that Ian caused $112.9 billion in damage, becoming the third-costliest hurricane in U.S. history. Yet Ian was just one of 18 billion-dollar weather and climate disasters recorded by the NOAA in the U.S. in 2022,3 after 20 in 2021.
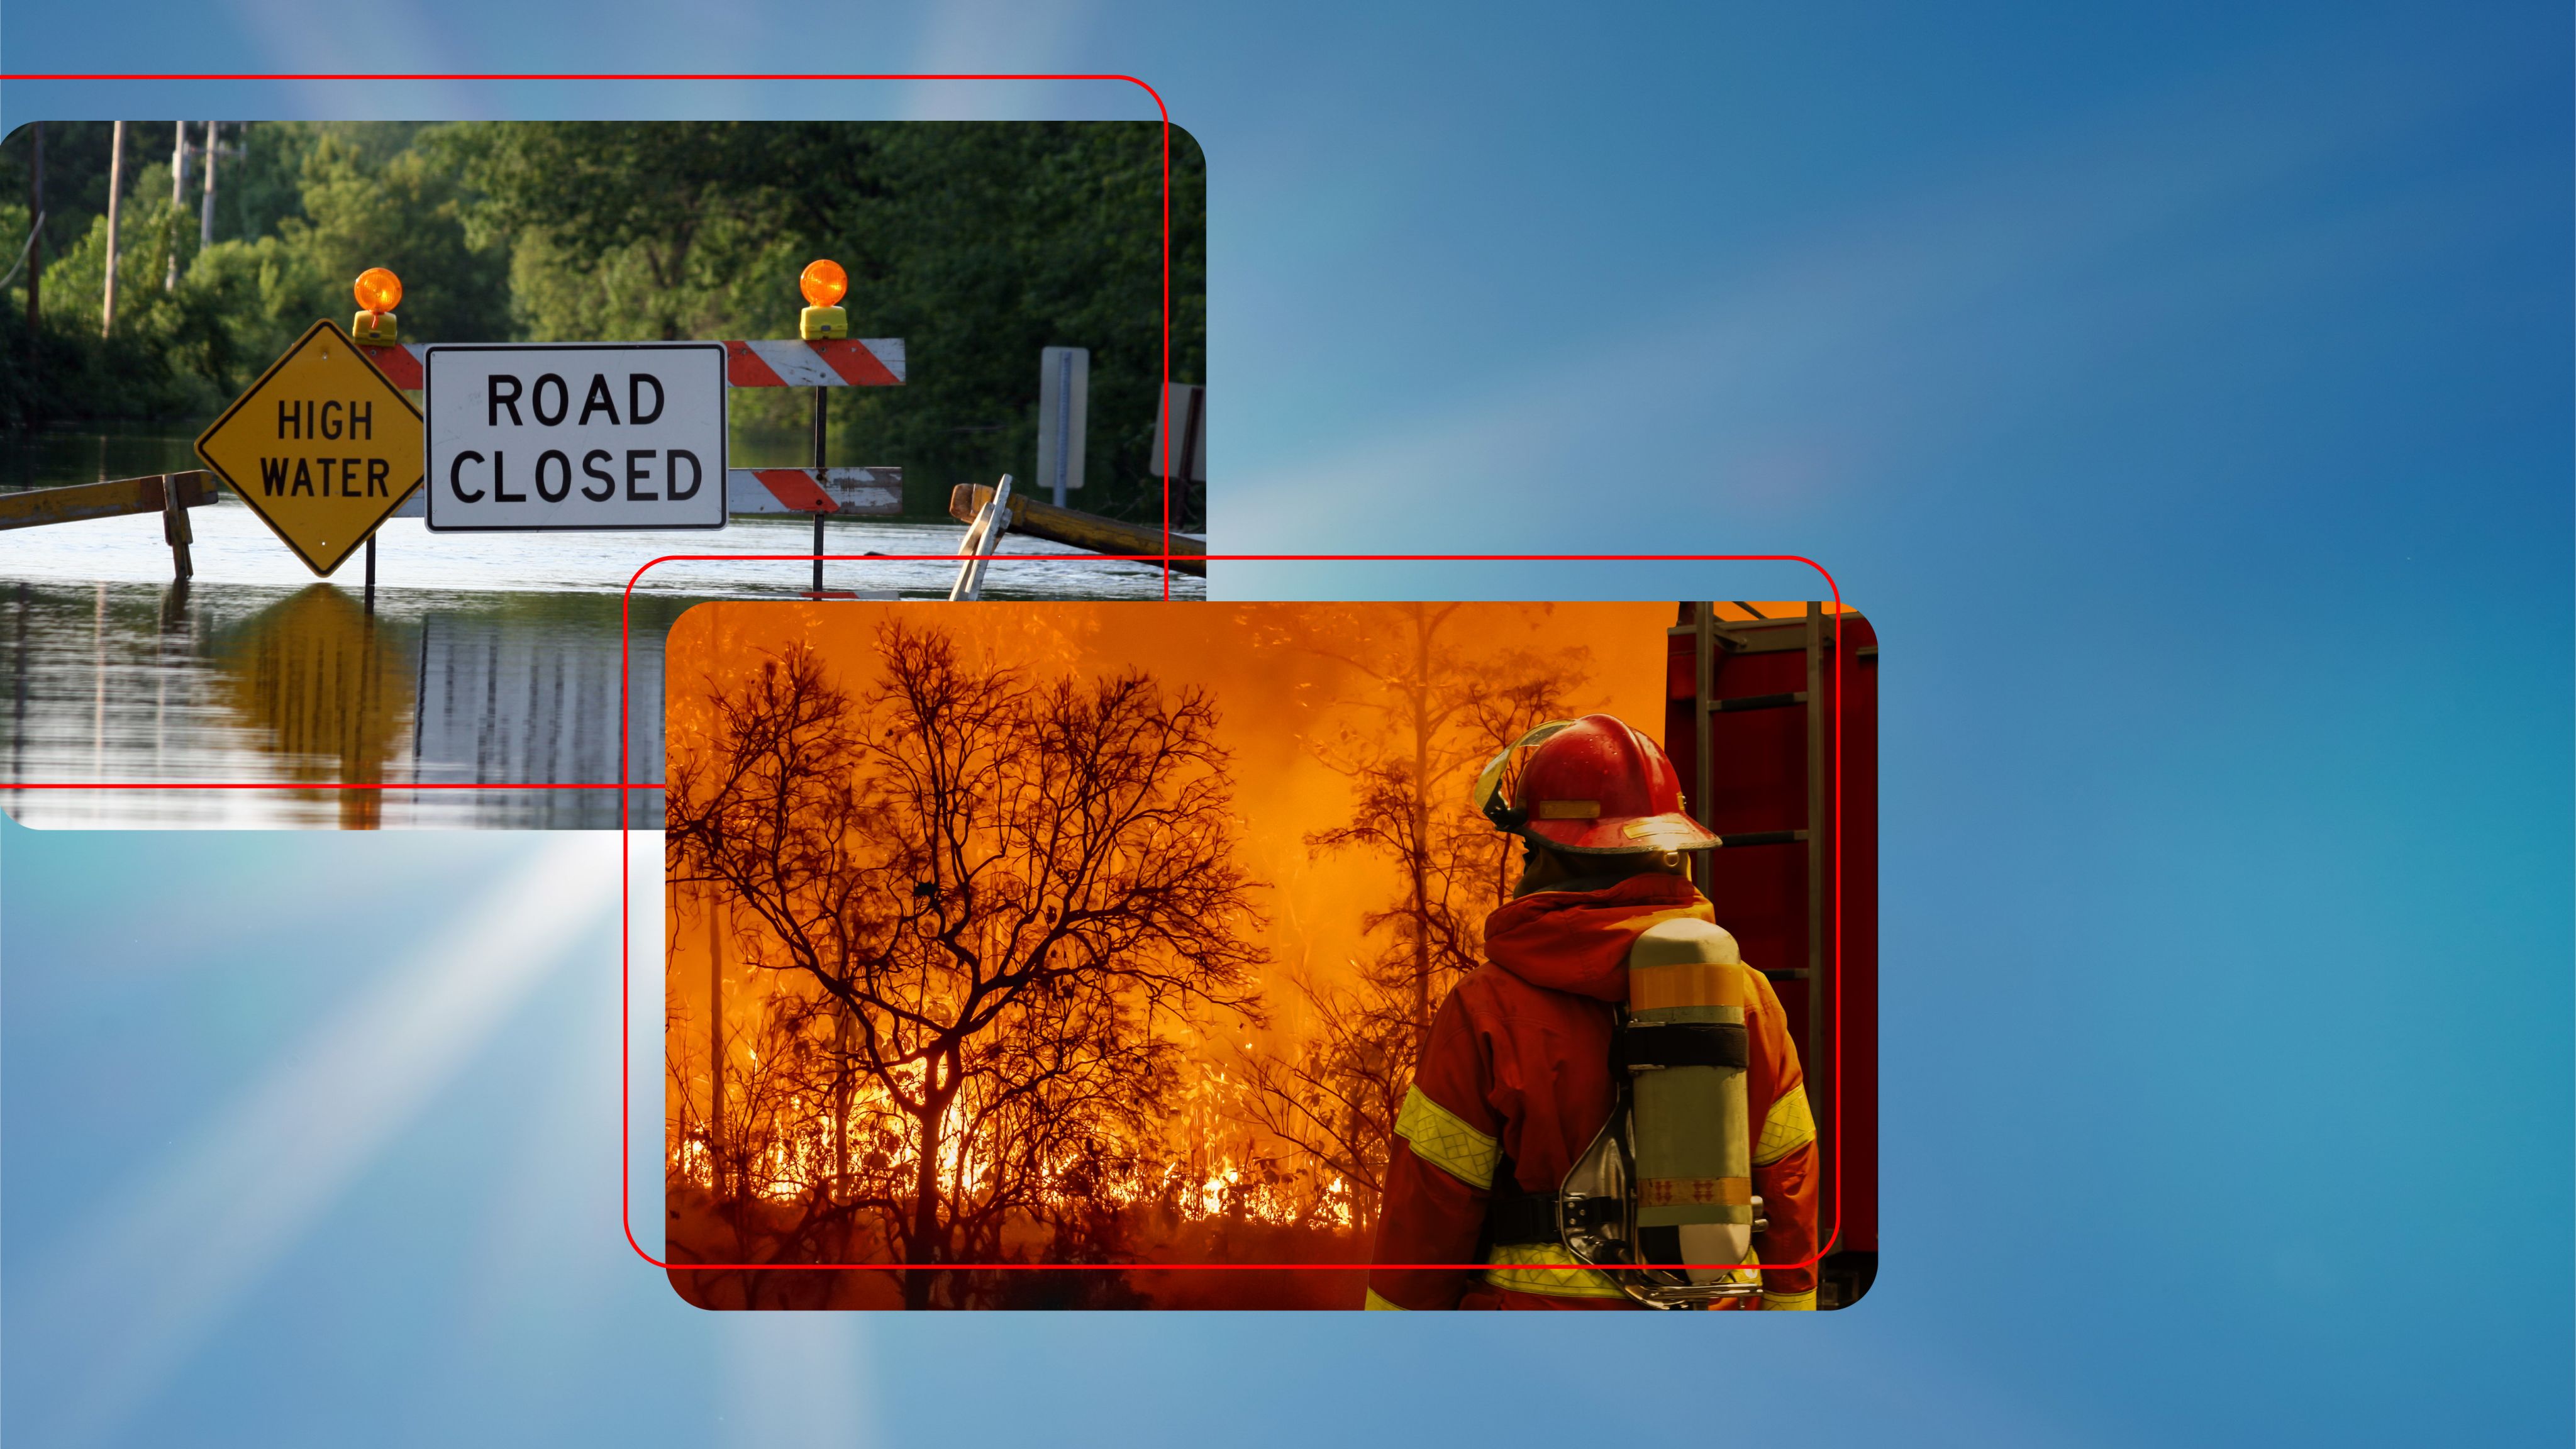
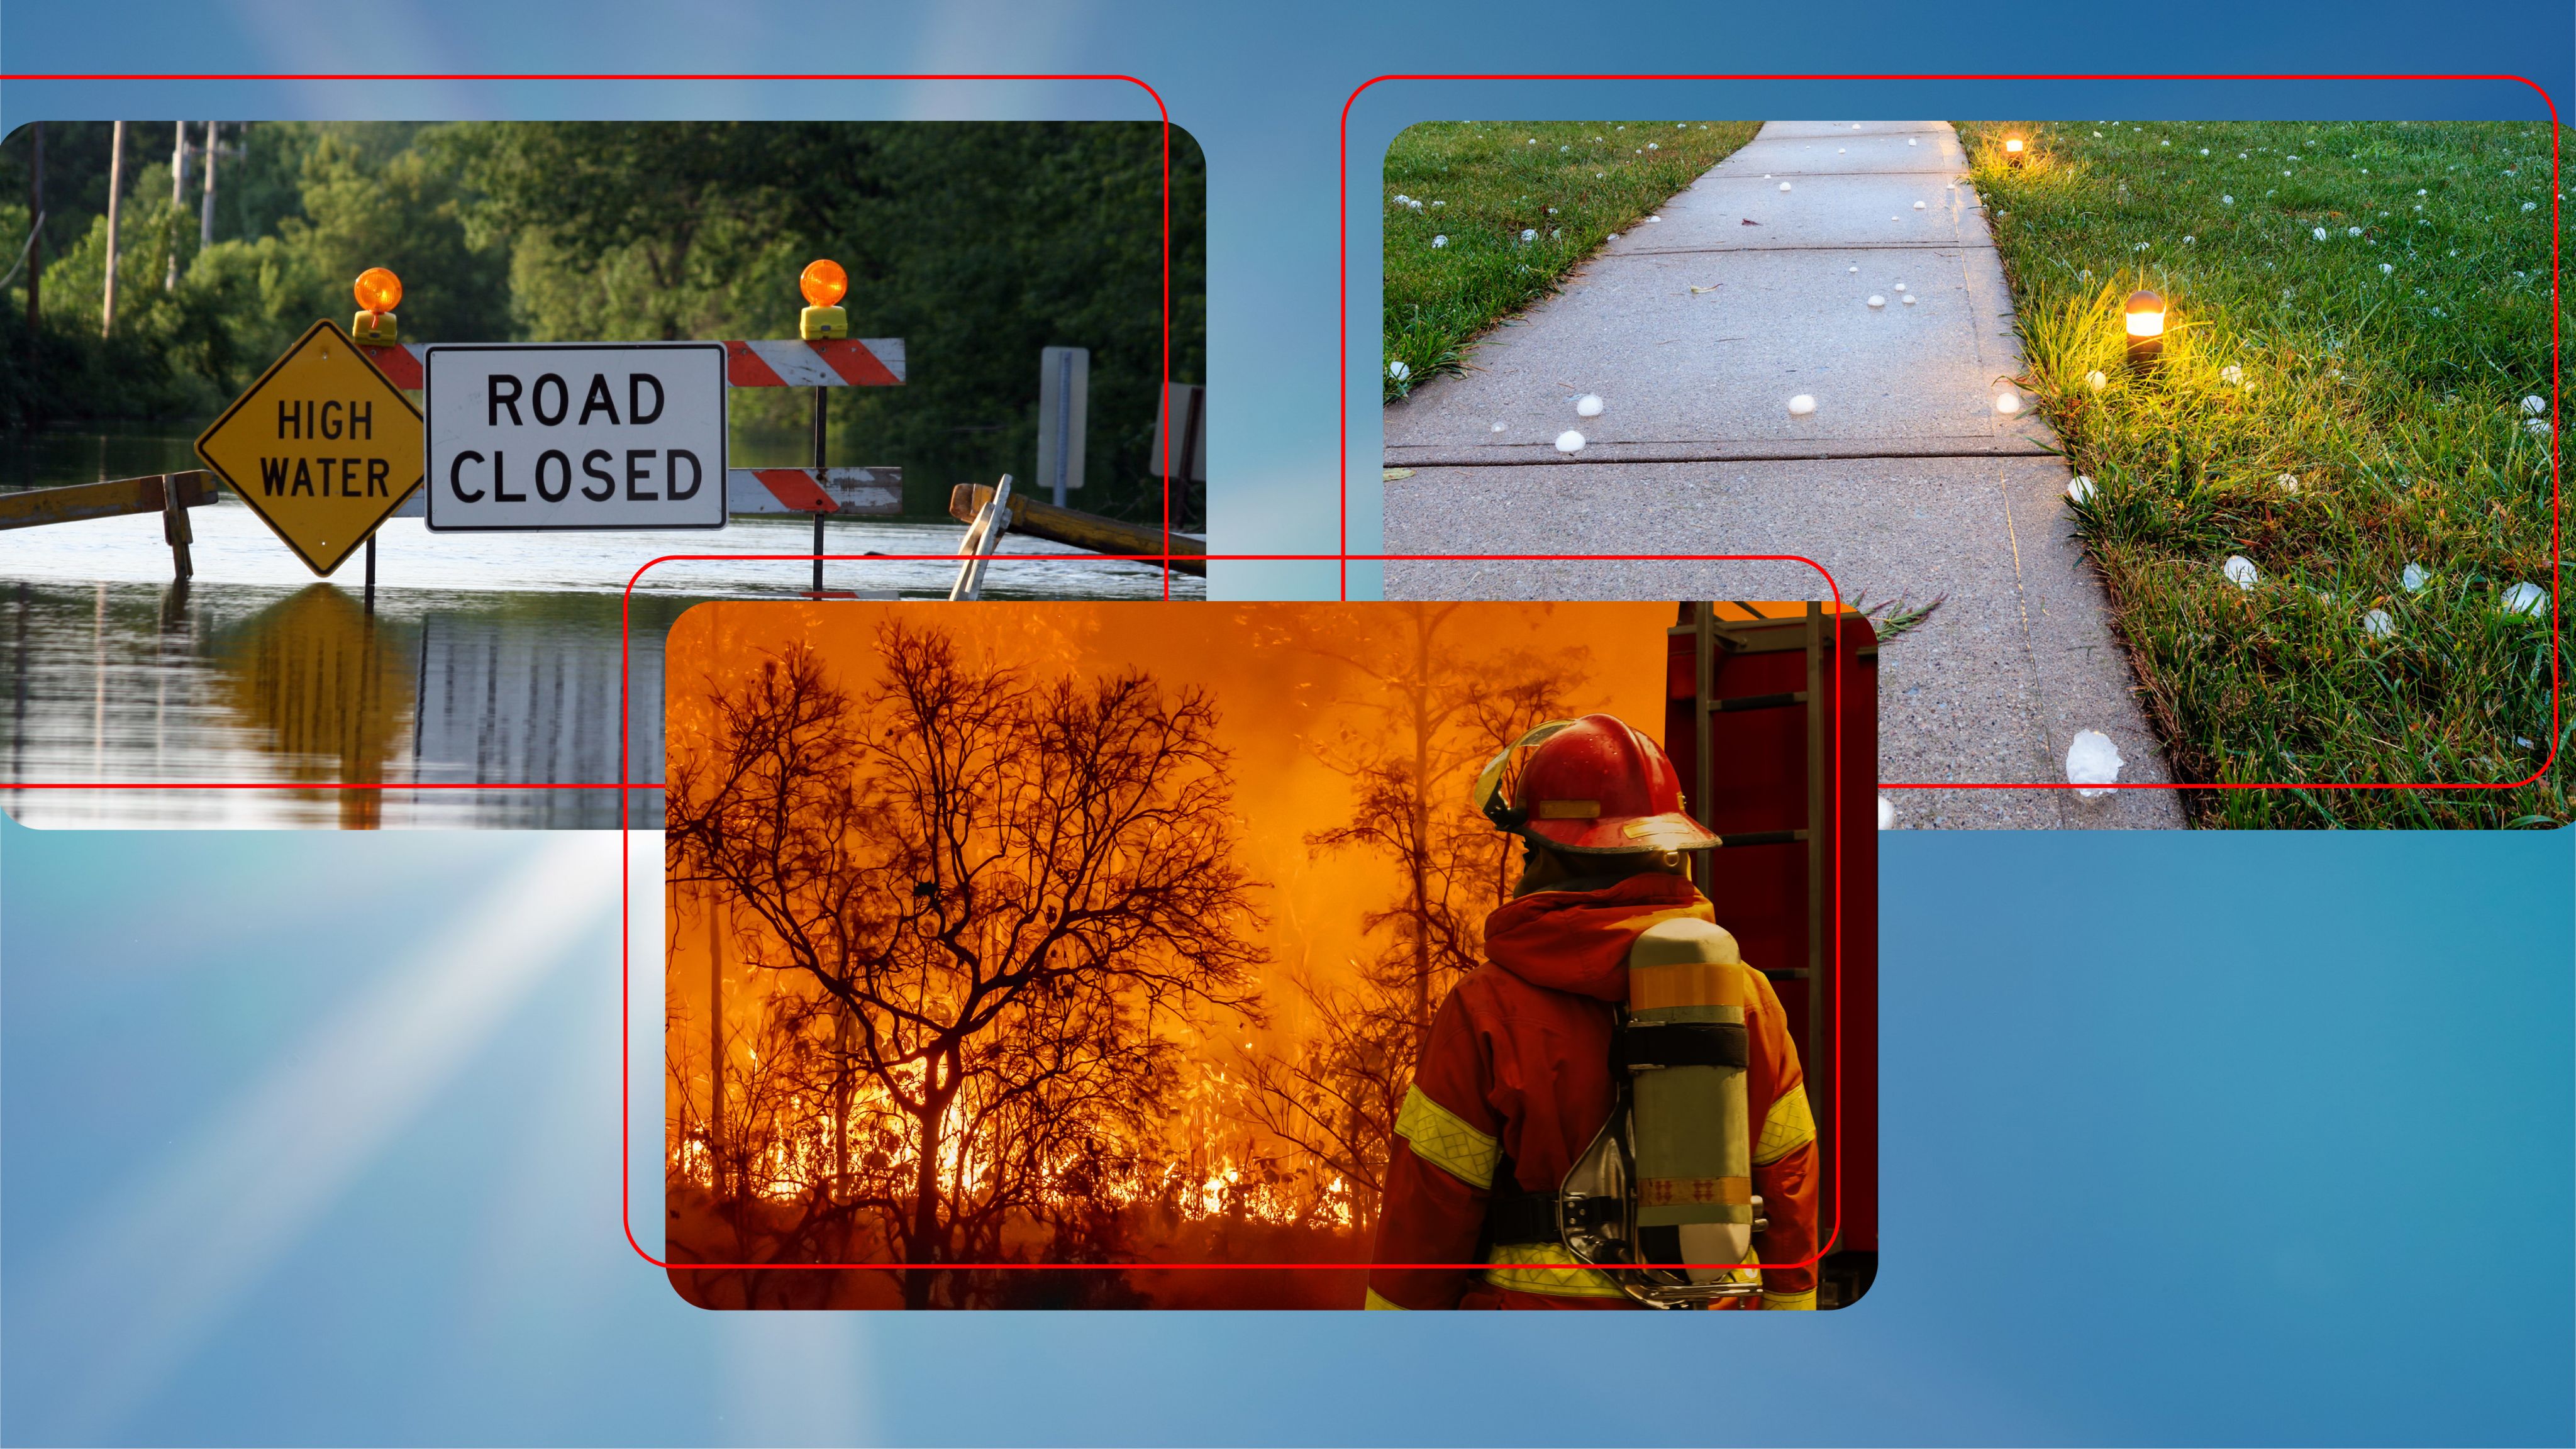
Fire, flood, hail, tornados and drought are all contributing to a weather system making immense demands of the insurance industry. If the industry is to manage growing risk while delivering an affordable, equitable and sustainable service to customers, it is clear it needs to adopt an innovative approach to its operations. Fortunately, the tools with which it can do this are developing as rapidly as the challenge itself.
1. washingtonpost.com/nation/2022/09/29/hurricane-ian-survival-stories/
2. nhc.noaa.gov/data/tcr/AL092022_Ian.pdf
3. ncei.noaa.gov/access/billions/

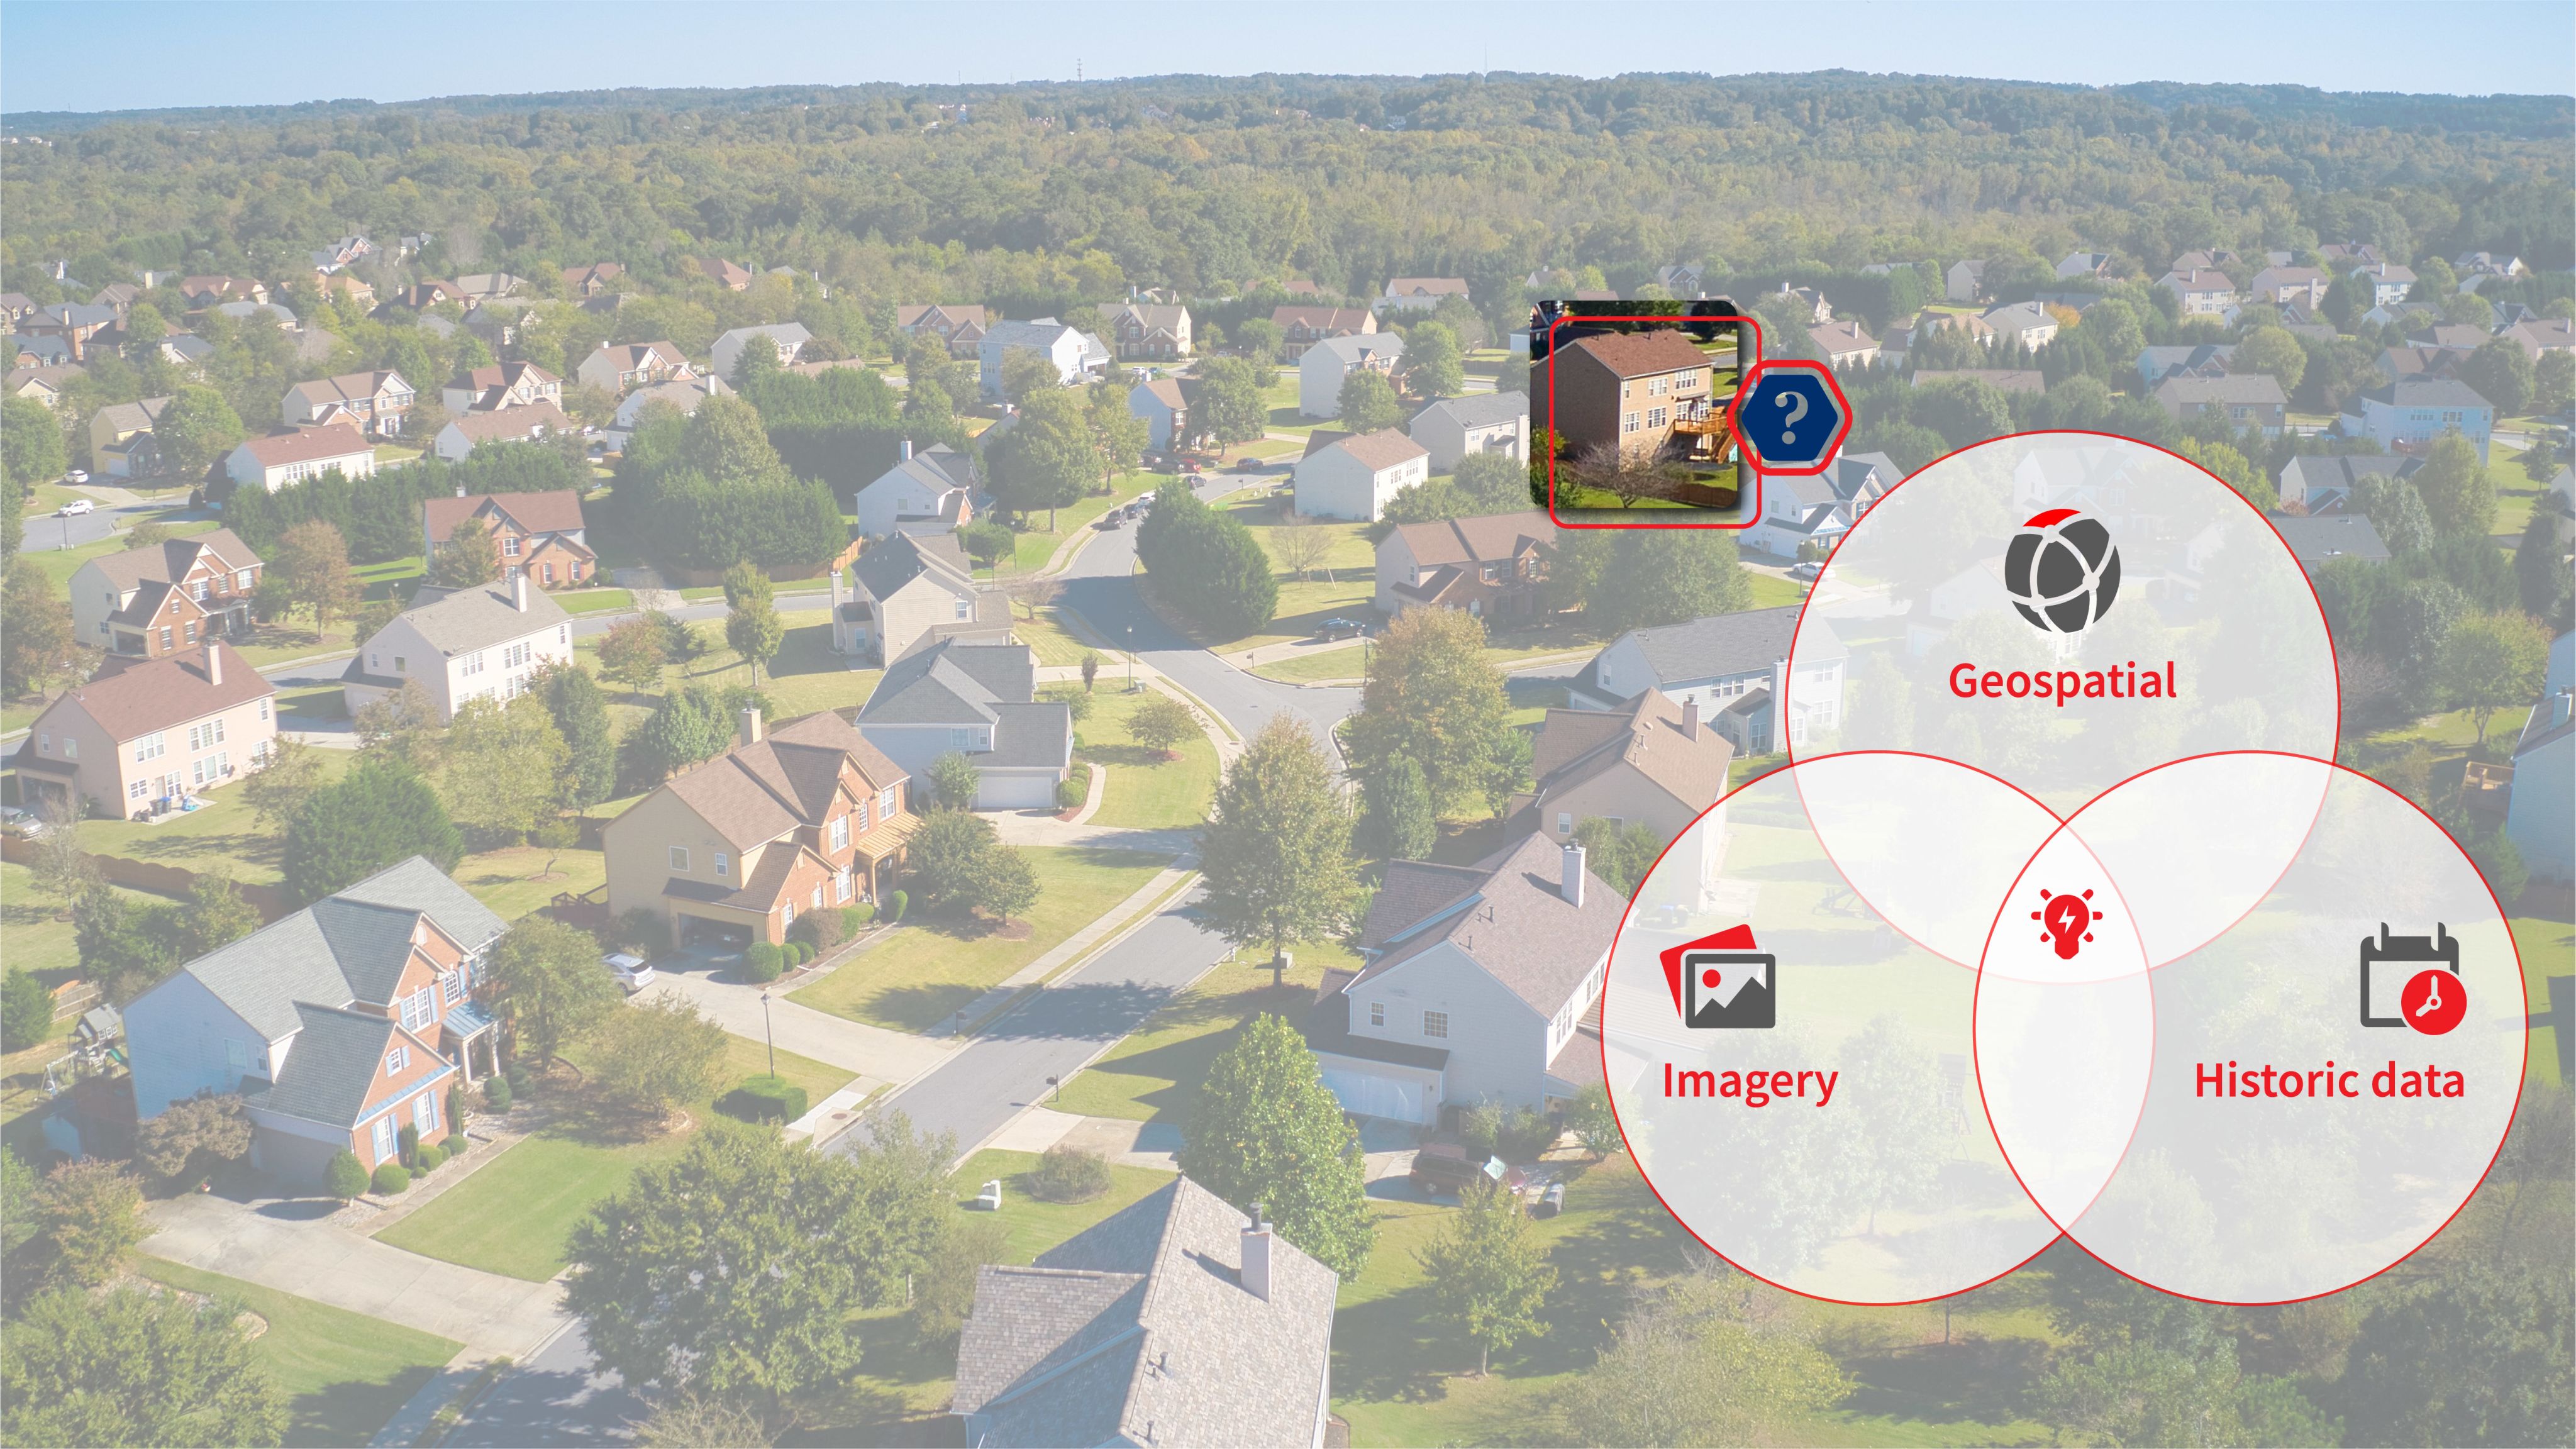
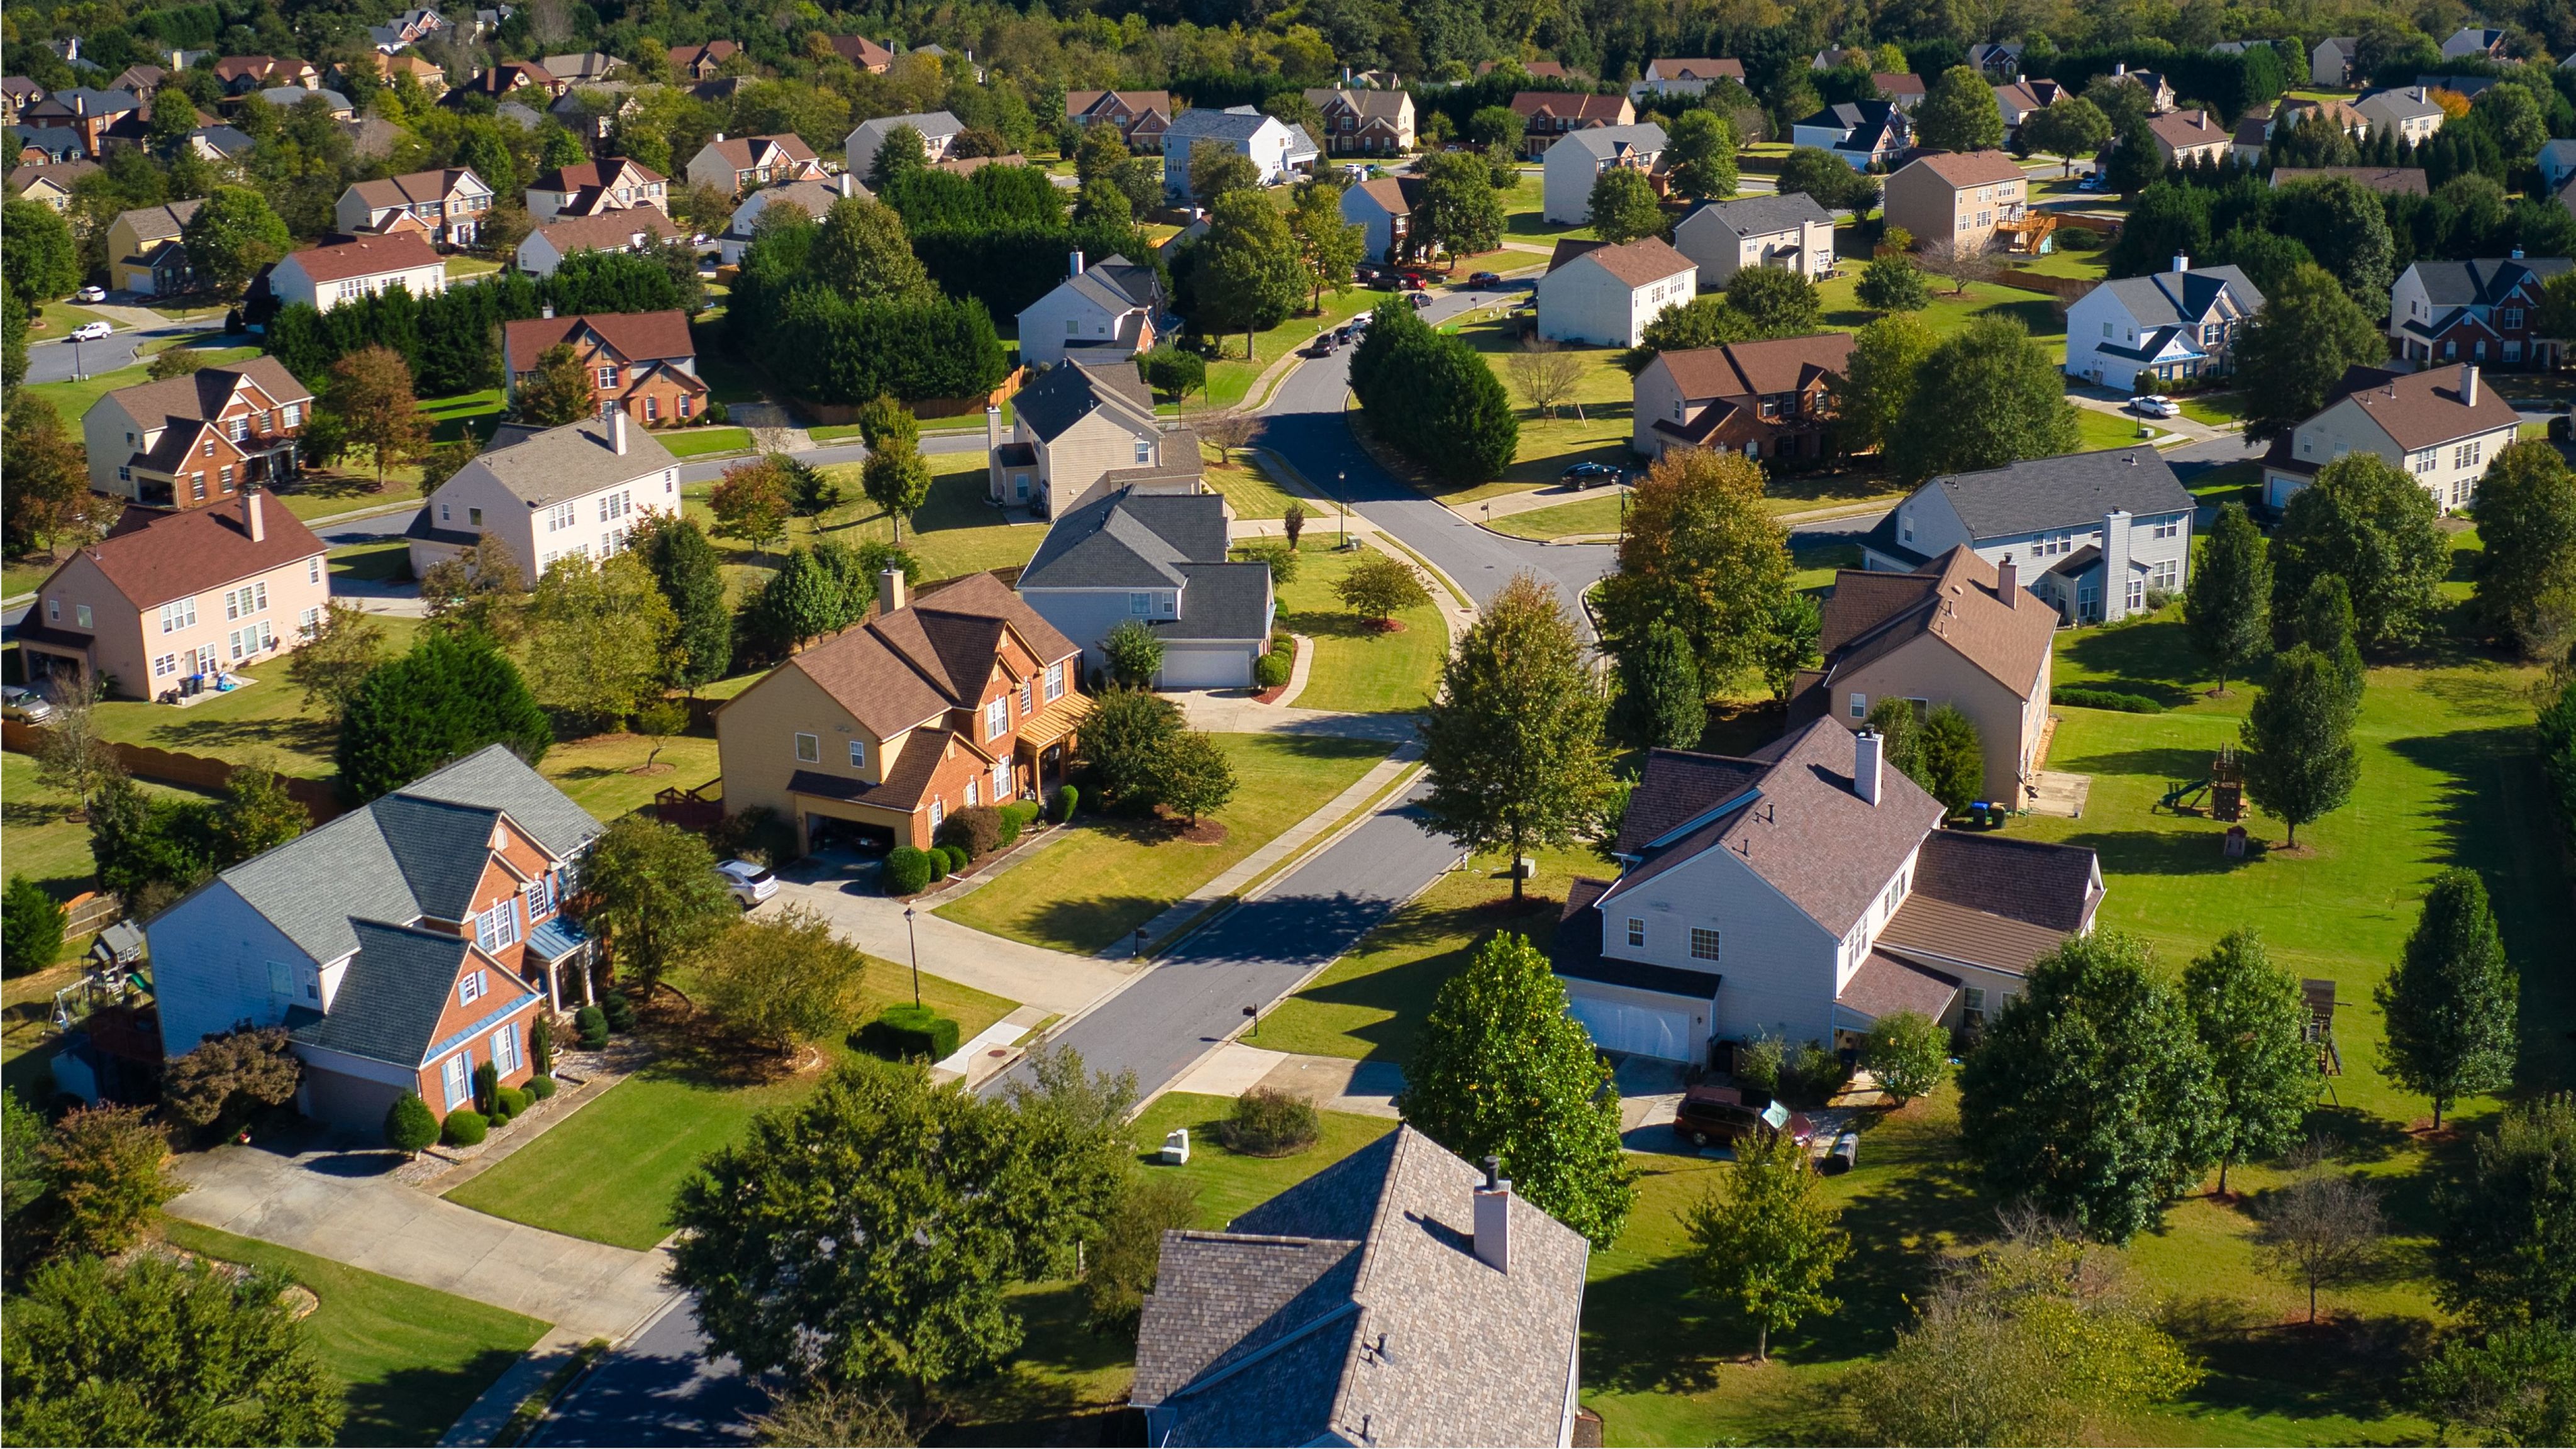
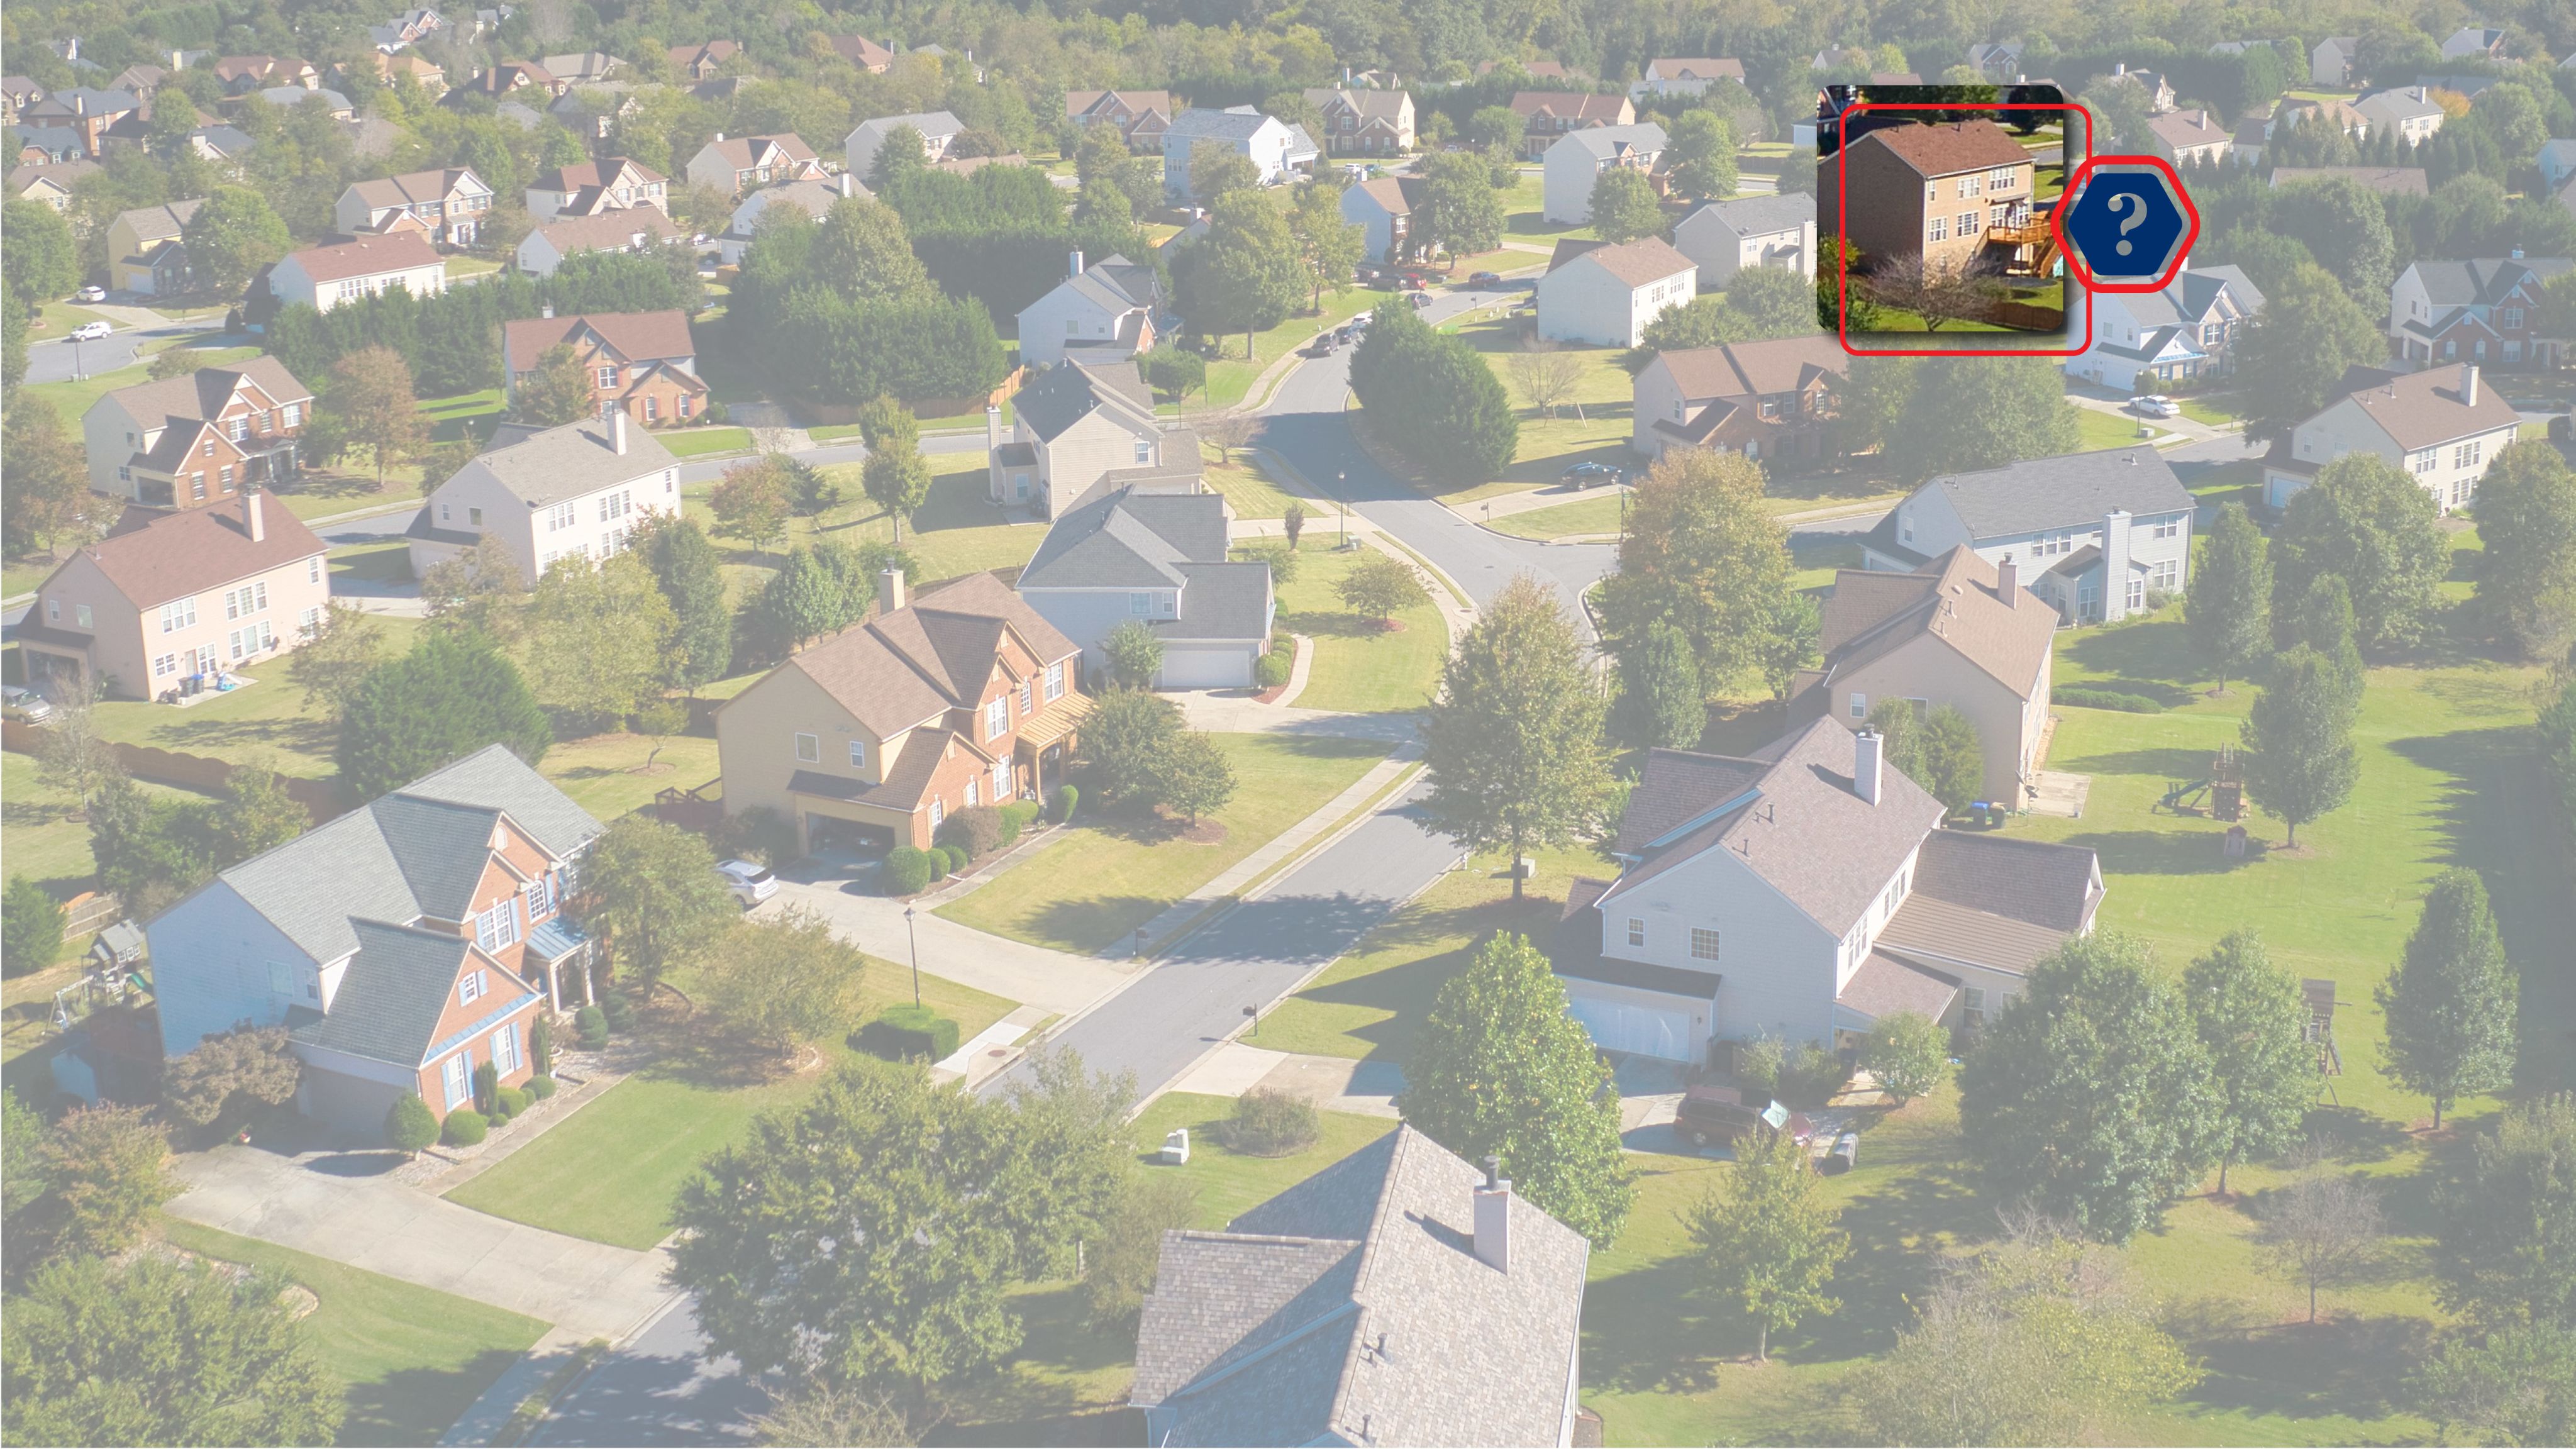
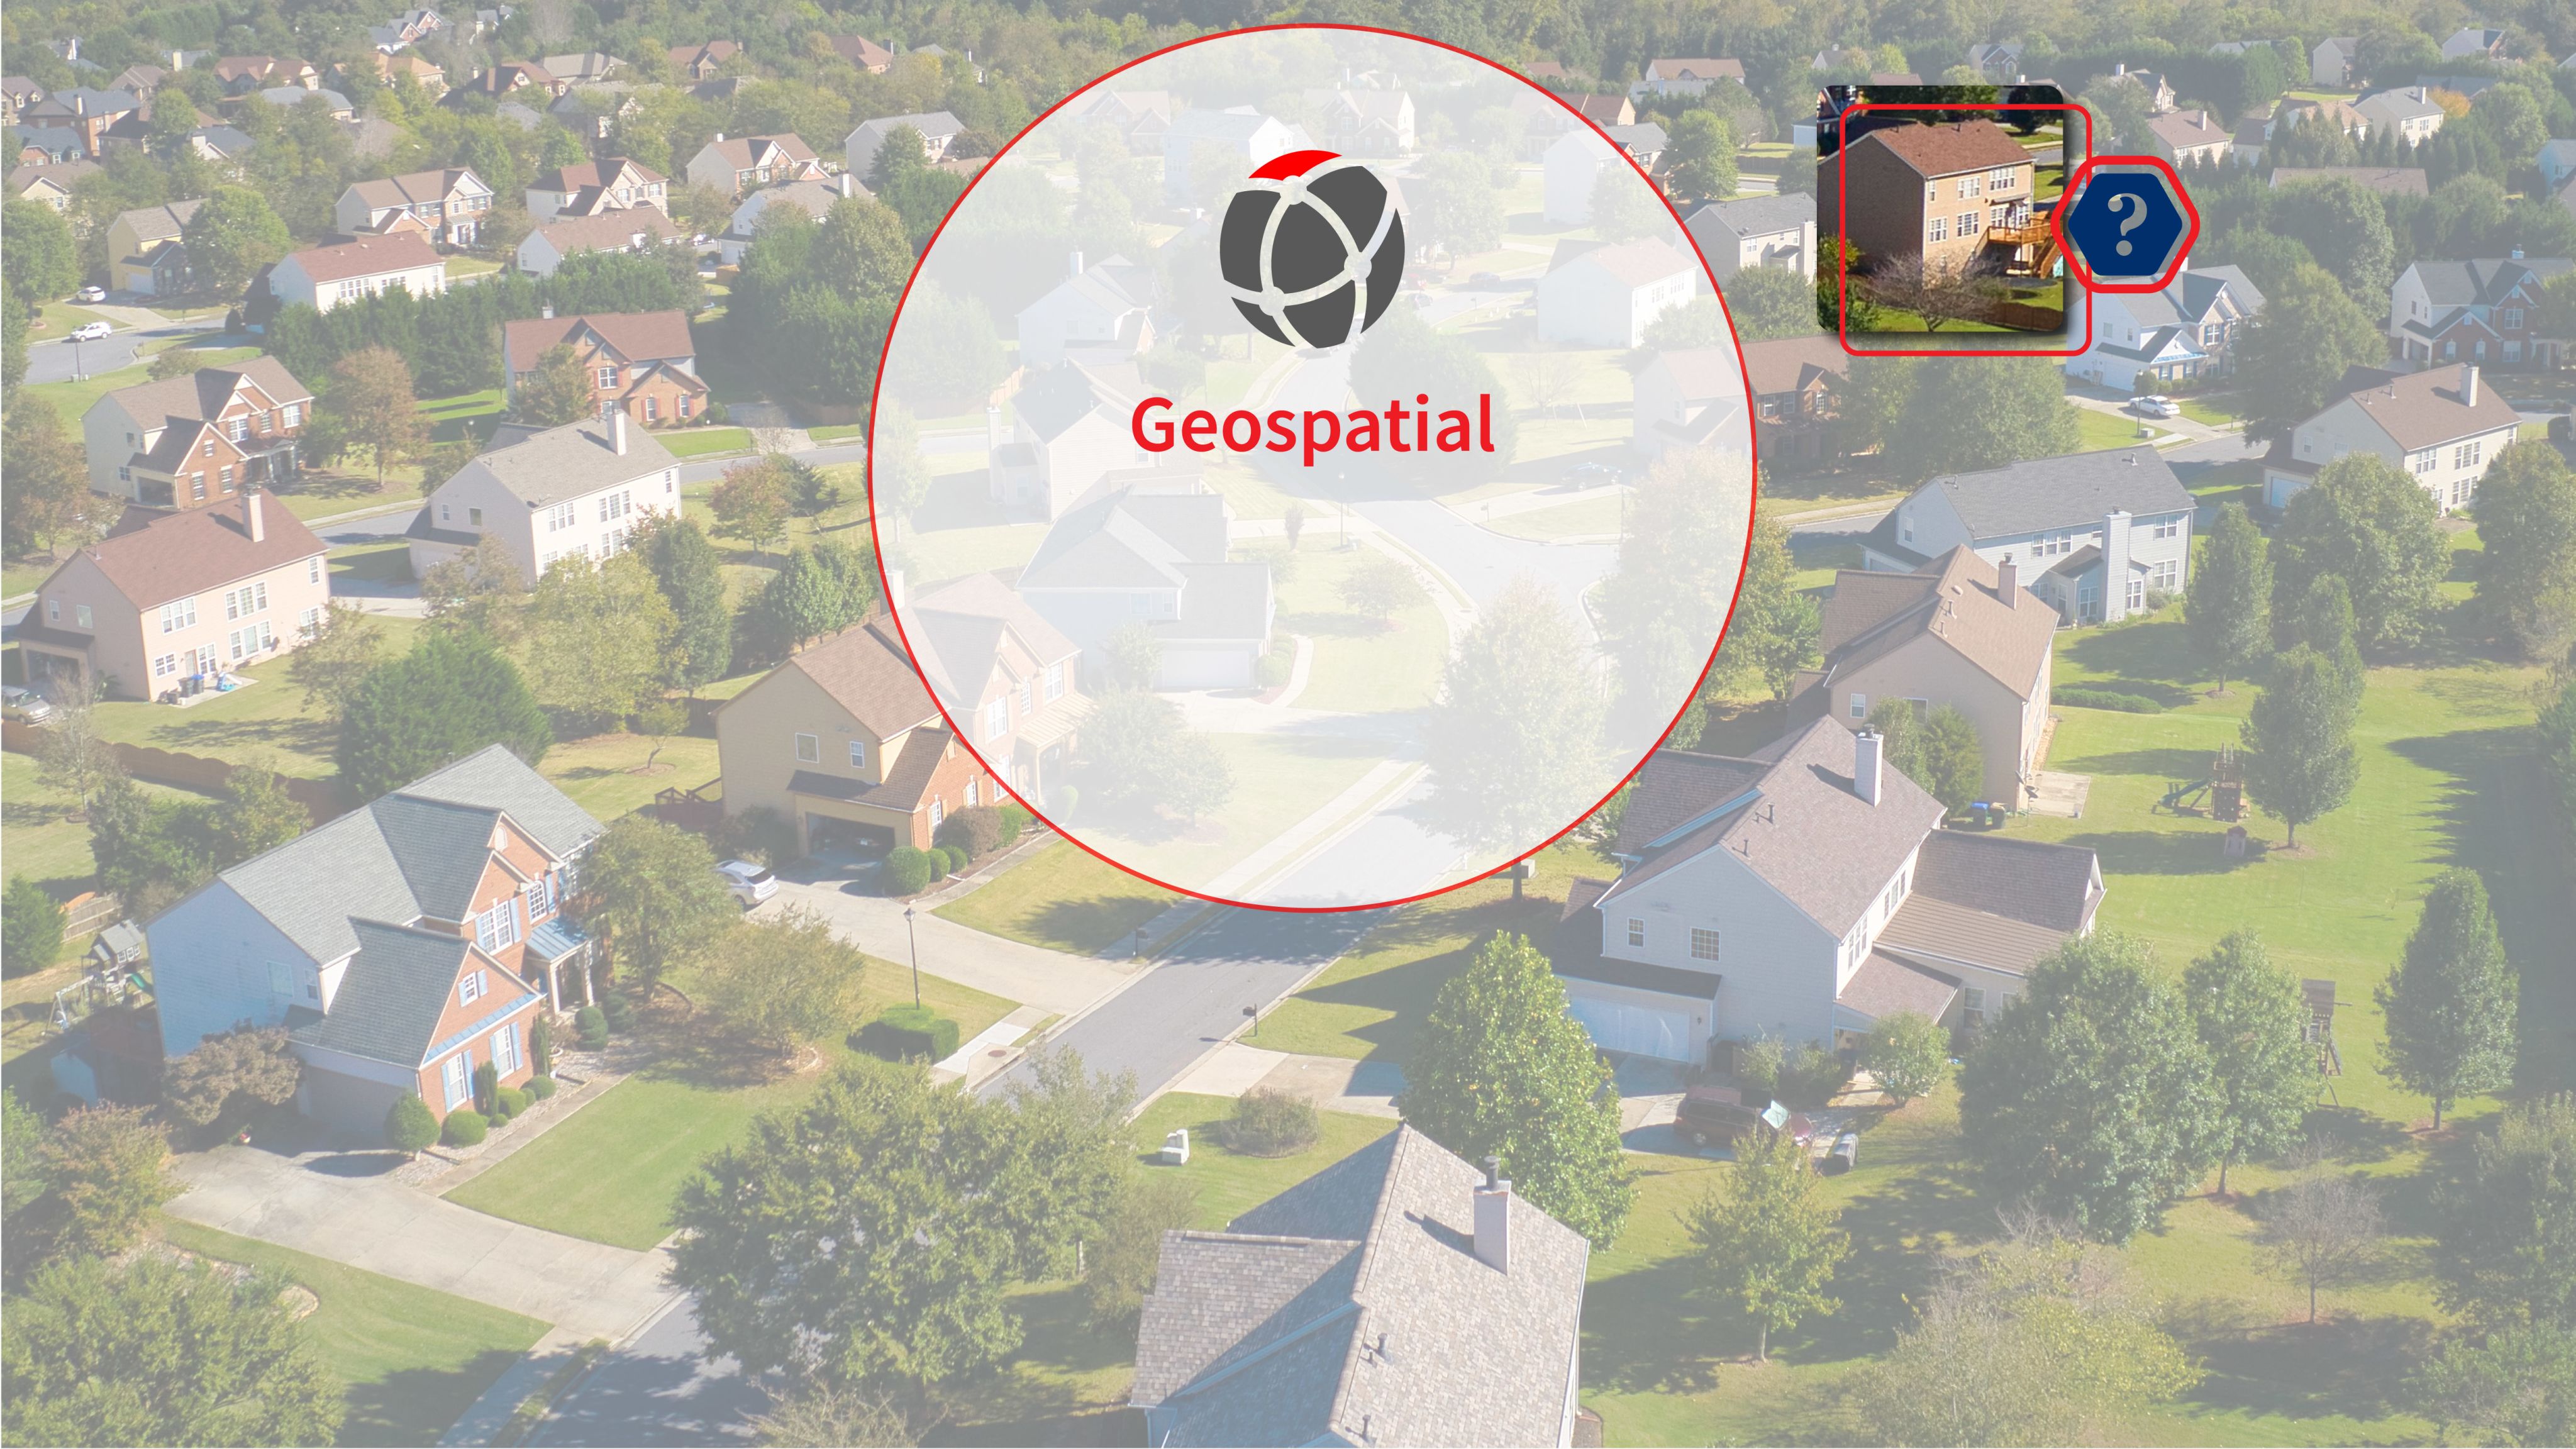
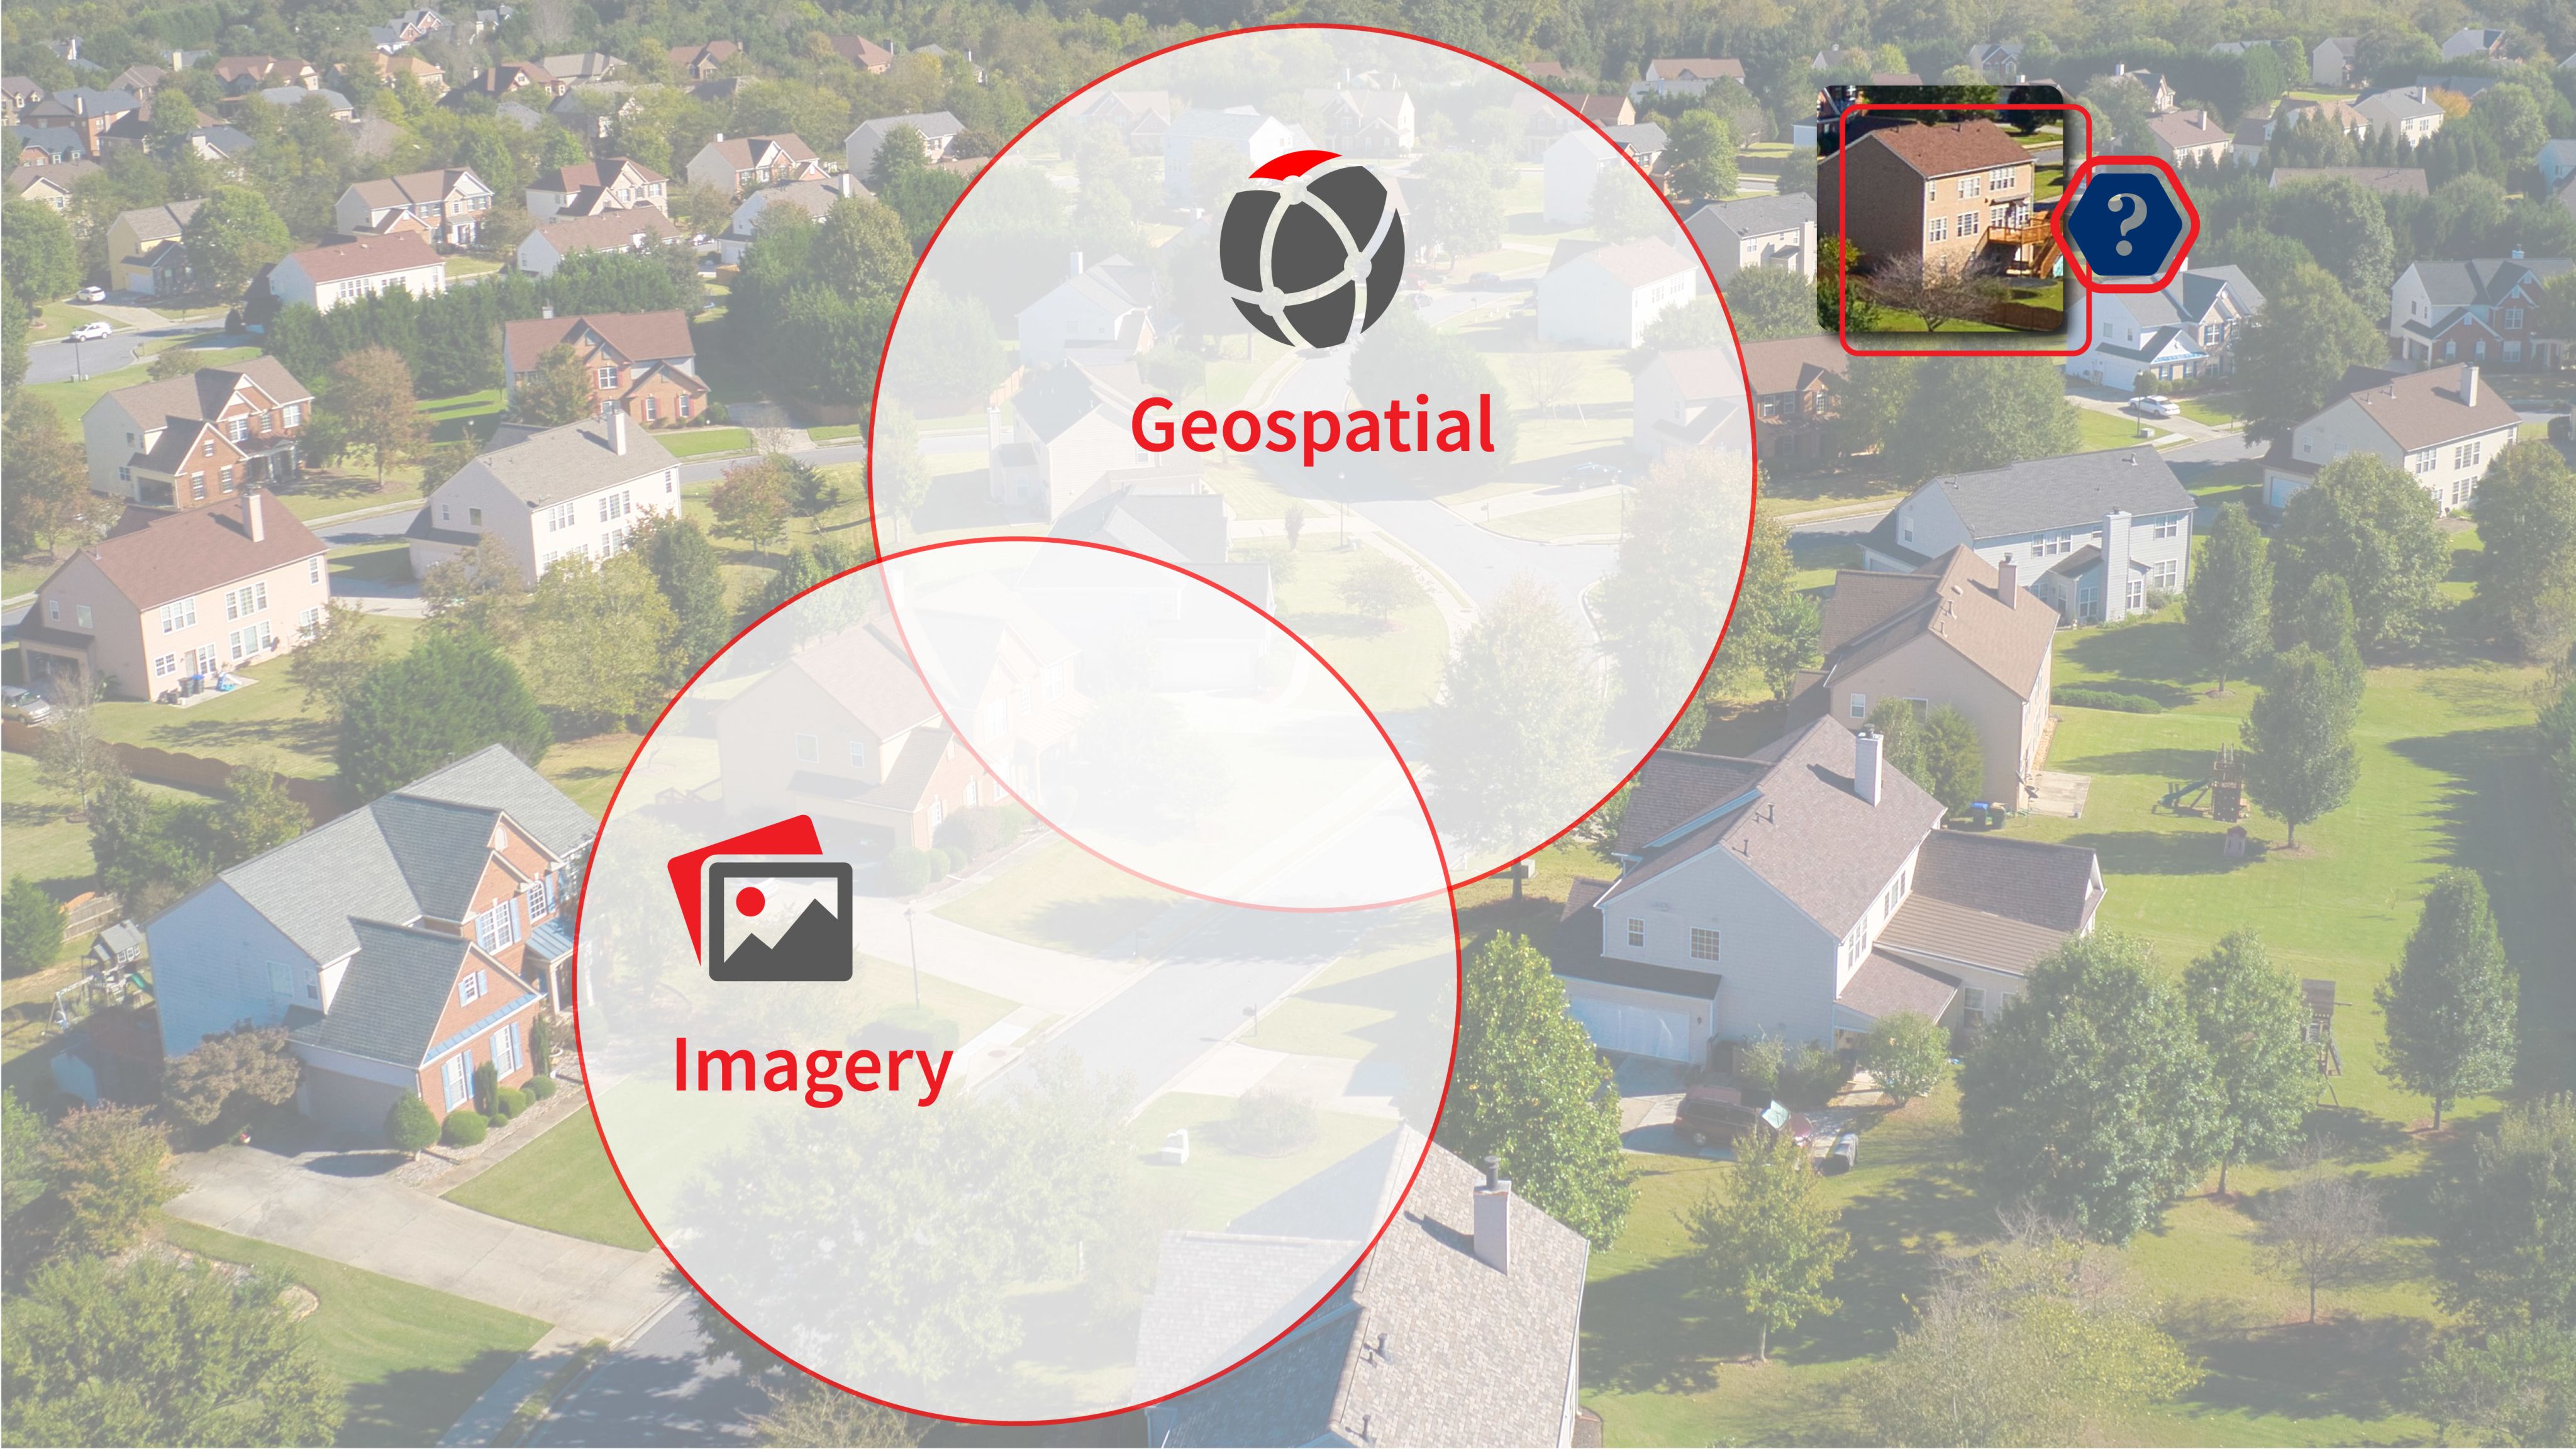
The combination of multiple data sources – including geospatial information, imagery and historical records – with predictive analytics and artificial intelligence solutions can not only help carriers to understand risk better and price policies accordingly, but also to automate and streamline their operations. That in turn can stimulate improved construction that builds more resilient communities.

Climate change, costs and migration
The eight years since 2015 have been the hottest on record, according to the World Meteorological Organization.4 And with the warming come the extreme events. Eight of California’s 10 largest wildfires have taken place since 2017.5 The hurricane seasons of both 2021 and 2022 were among the most active in history, with a likelihood of worse to follow. According to the NOAA, the impact of warming on future tropical cyclones is expected to lead to greater coastal inundation, storm intensity and rainfall.6
What this all means for insurers is an increase in costs from property and casualty claims.
While the impact may vary from year to year, the longer-term trend is clearer. The 2022 LexisNexis Risk Solutions Home Trends Report pointed to a seven-year trend showing a steady increase in the cost and frequency of losses, not only for insurers but also for consumers.7
Other developments are also testing insurers’ traditional approach to risk, among them population changes. James Handley, director of data science at LexisNexis Risk Solutions, says the current domestic migration pattern that began in 2015 is one of deurbanization, given fresh momentum by the pandemic and a growing preference and ability for people to work from anywhere.
Much of that migration is taking Americans into areas under threat. Seven of the top 10 places experiencing positive migration are in areas of Florida and Texas at high risk of weather-related peril.8 So people are “moving into places where the cost of insurance and the cost of claims is extraordinarily high,” says Handley.
Bill Martin, president and CEO of Plymouth Rock Home Assurance, says the challenge is clear and the industry needs to address it. “The last five years of catastrophes are twice the cost of the prior 15 years, and they’re twice the cost of the prior 100 years,” he says. “We do have more damage, and we have to pay for it if we’re going to insure it.”
4. public.wmo.int/en/media/press-release/past-eight-years-confirmed-be-eight-warmest-record#:~:text=The%20warmest%20eight%20years%20have,contributed%20to%20record%20global%20temperatures.
5. reuters.com/graphics/CALIFORNIA-WILDFIRES/gdpzyjxmovw/
6. gfdl.noaa.gov/global-warming-and-hurricanes/
7. LexisNexis® 2022 US Home Insurance Trends Report.
8. LexisNexis® 2021 US Home Insurance Trends Report.
Leveraging data and technological advances
To respond effectively to intensifying climate risk, insurers must use data and the technology, in particular artificial intelligence, that can unlock the actionable insights the data provides. Those insights will allow insurers to assess risk better, to serve consumers more effectively, contain cost and margins, and enable better decision-making throughout the life cycle of insurance policy and property.
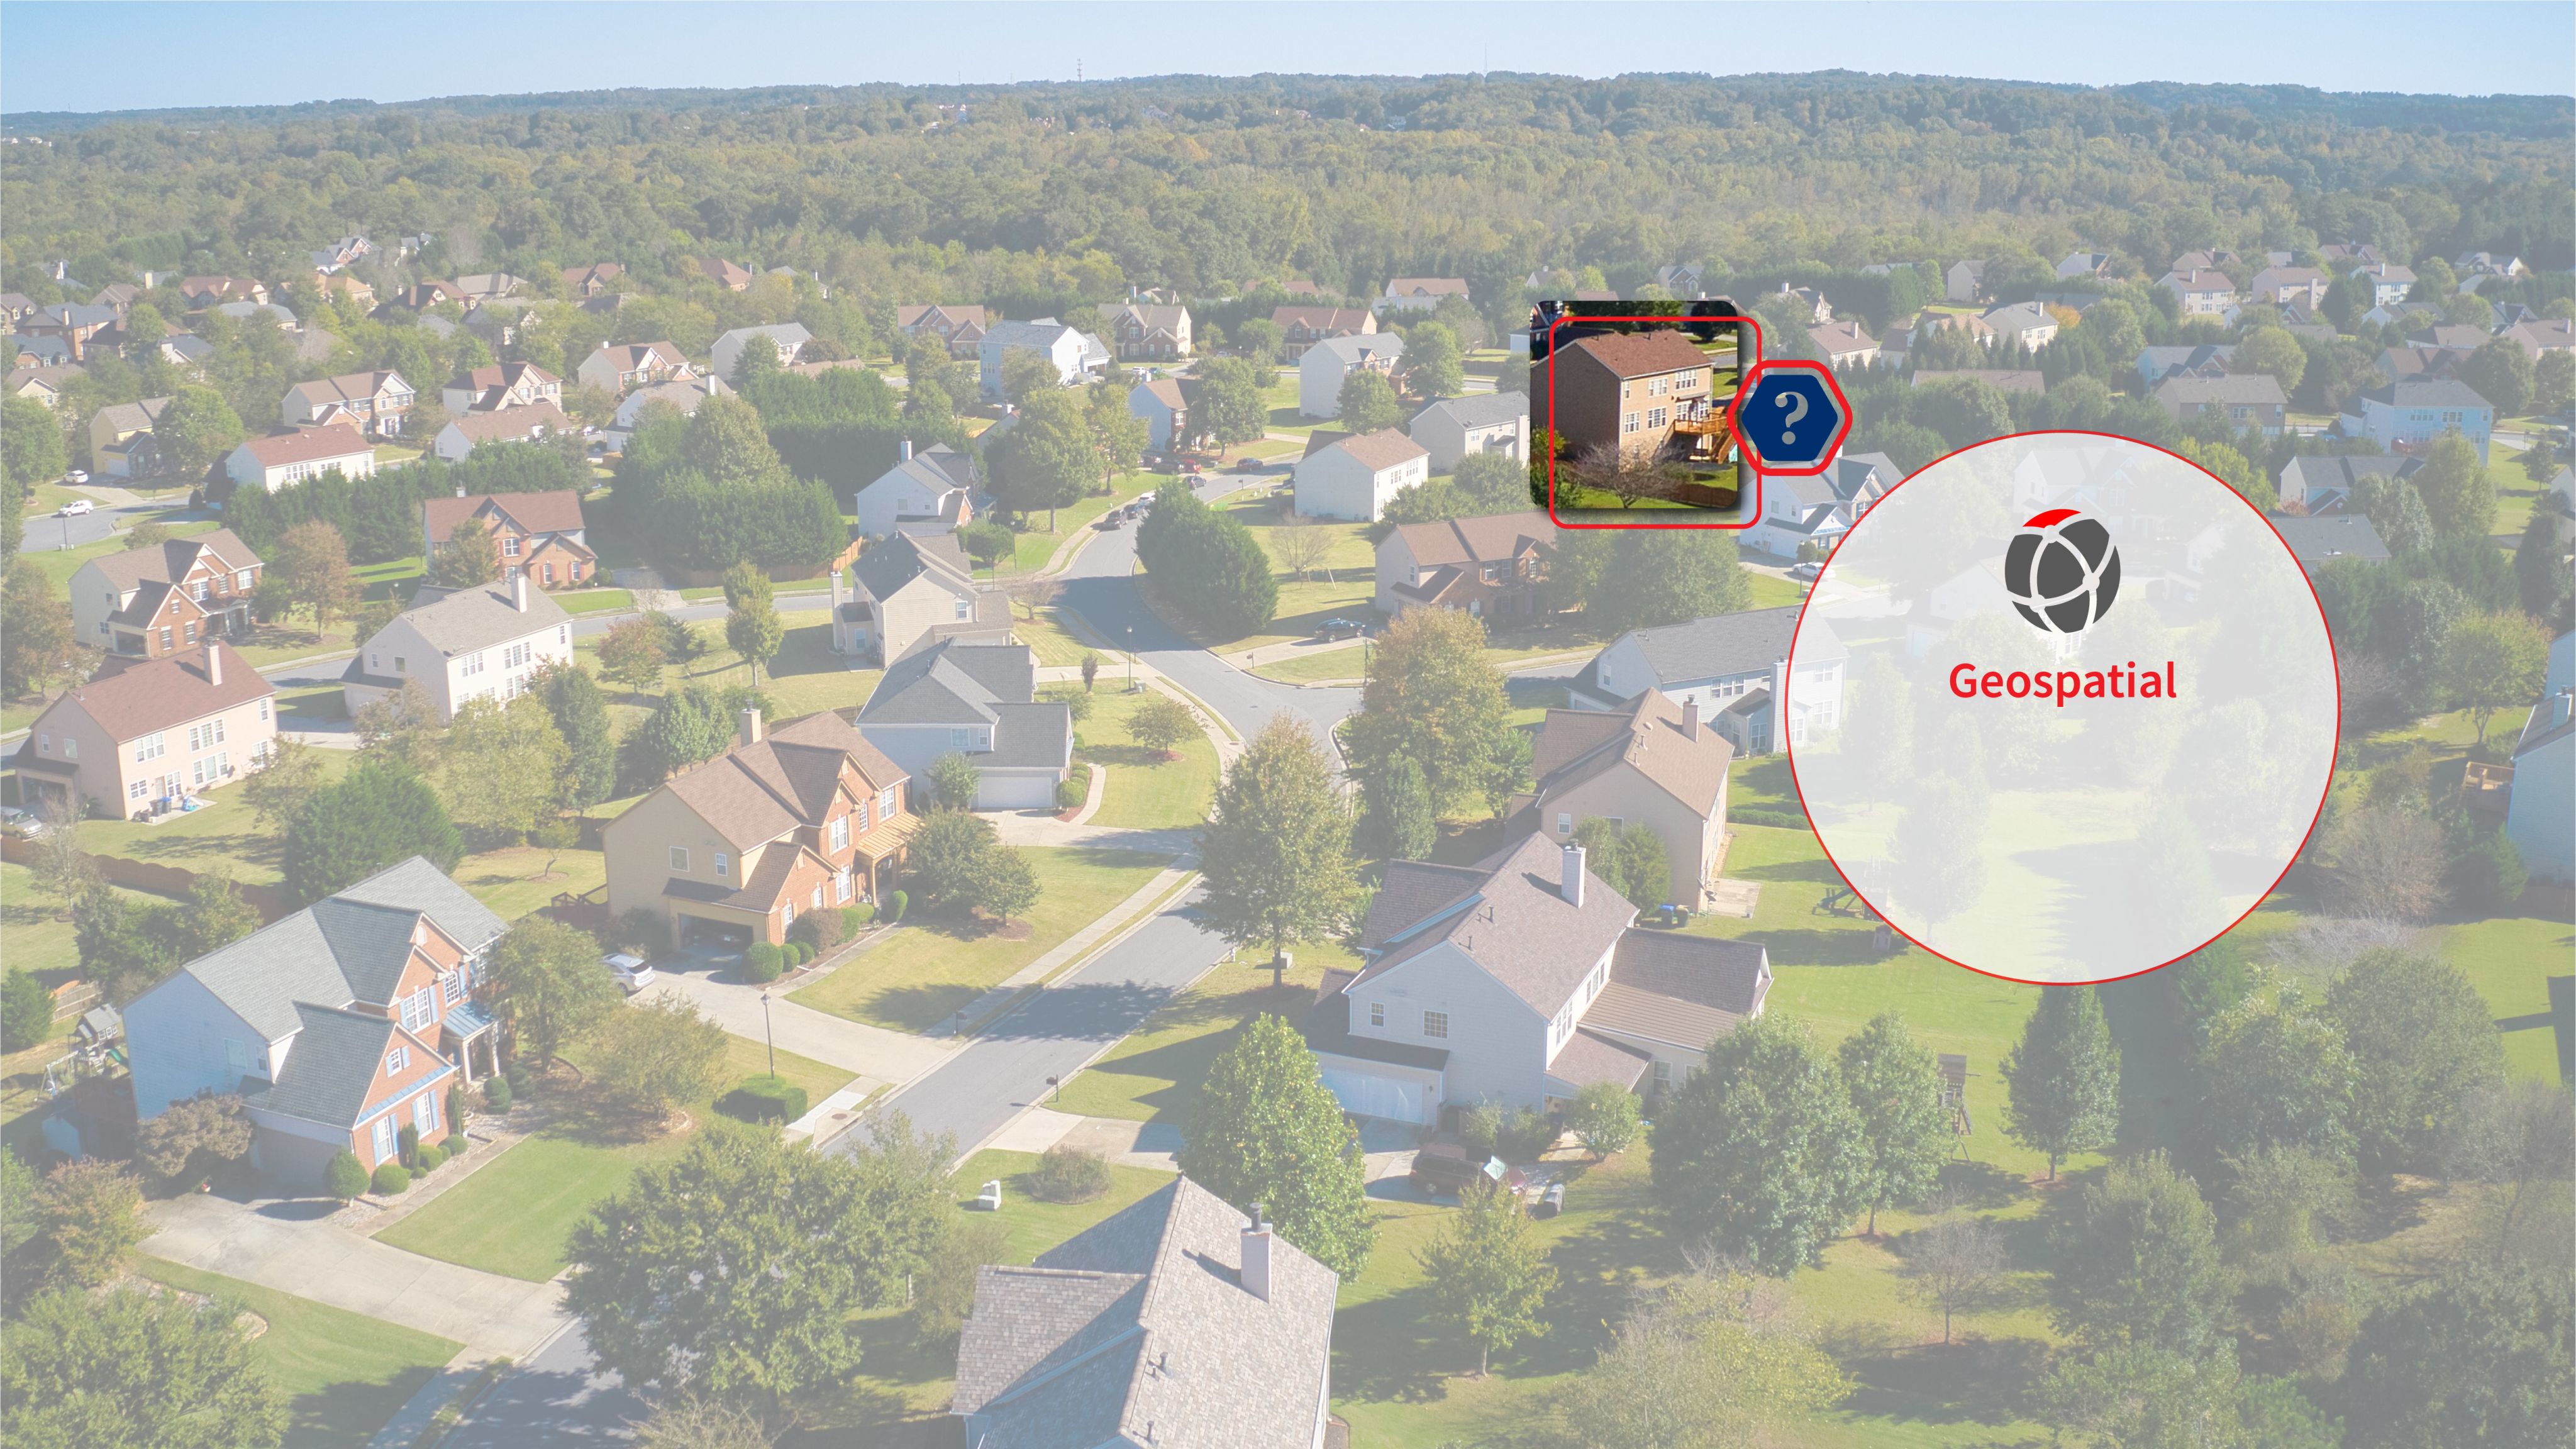
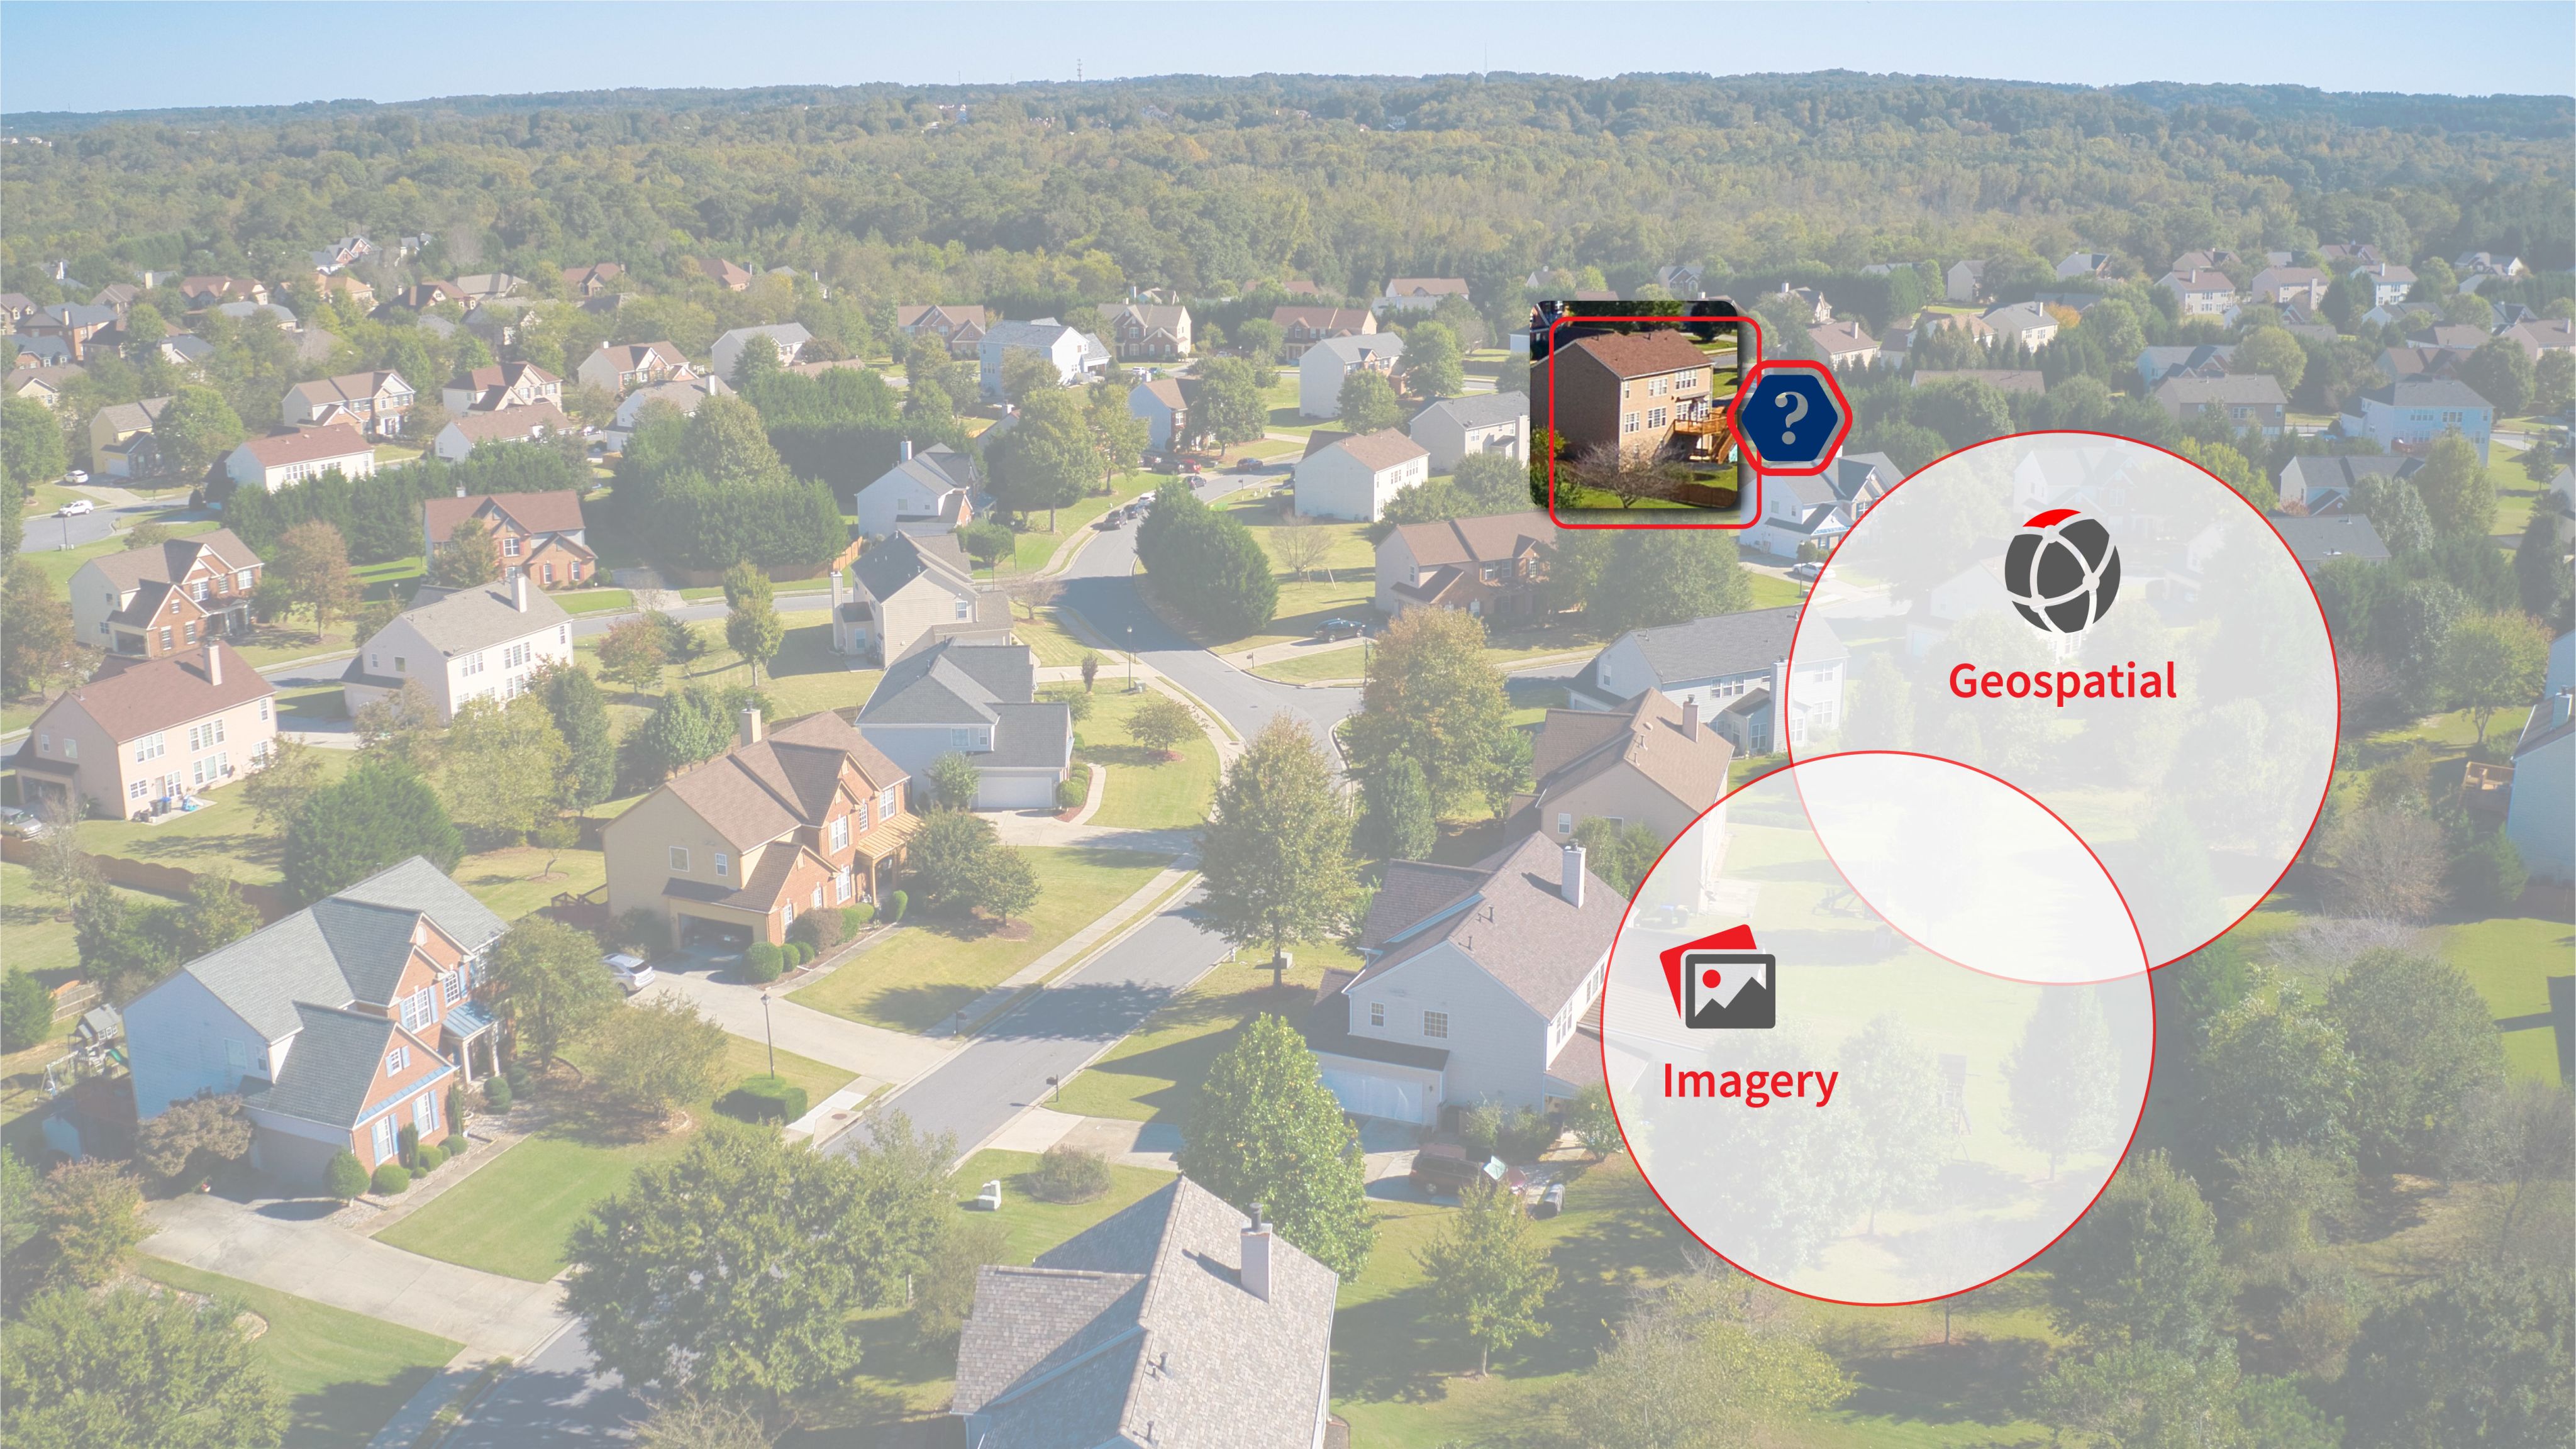
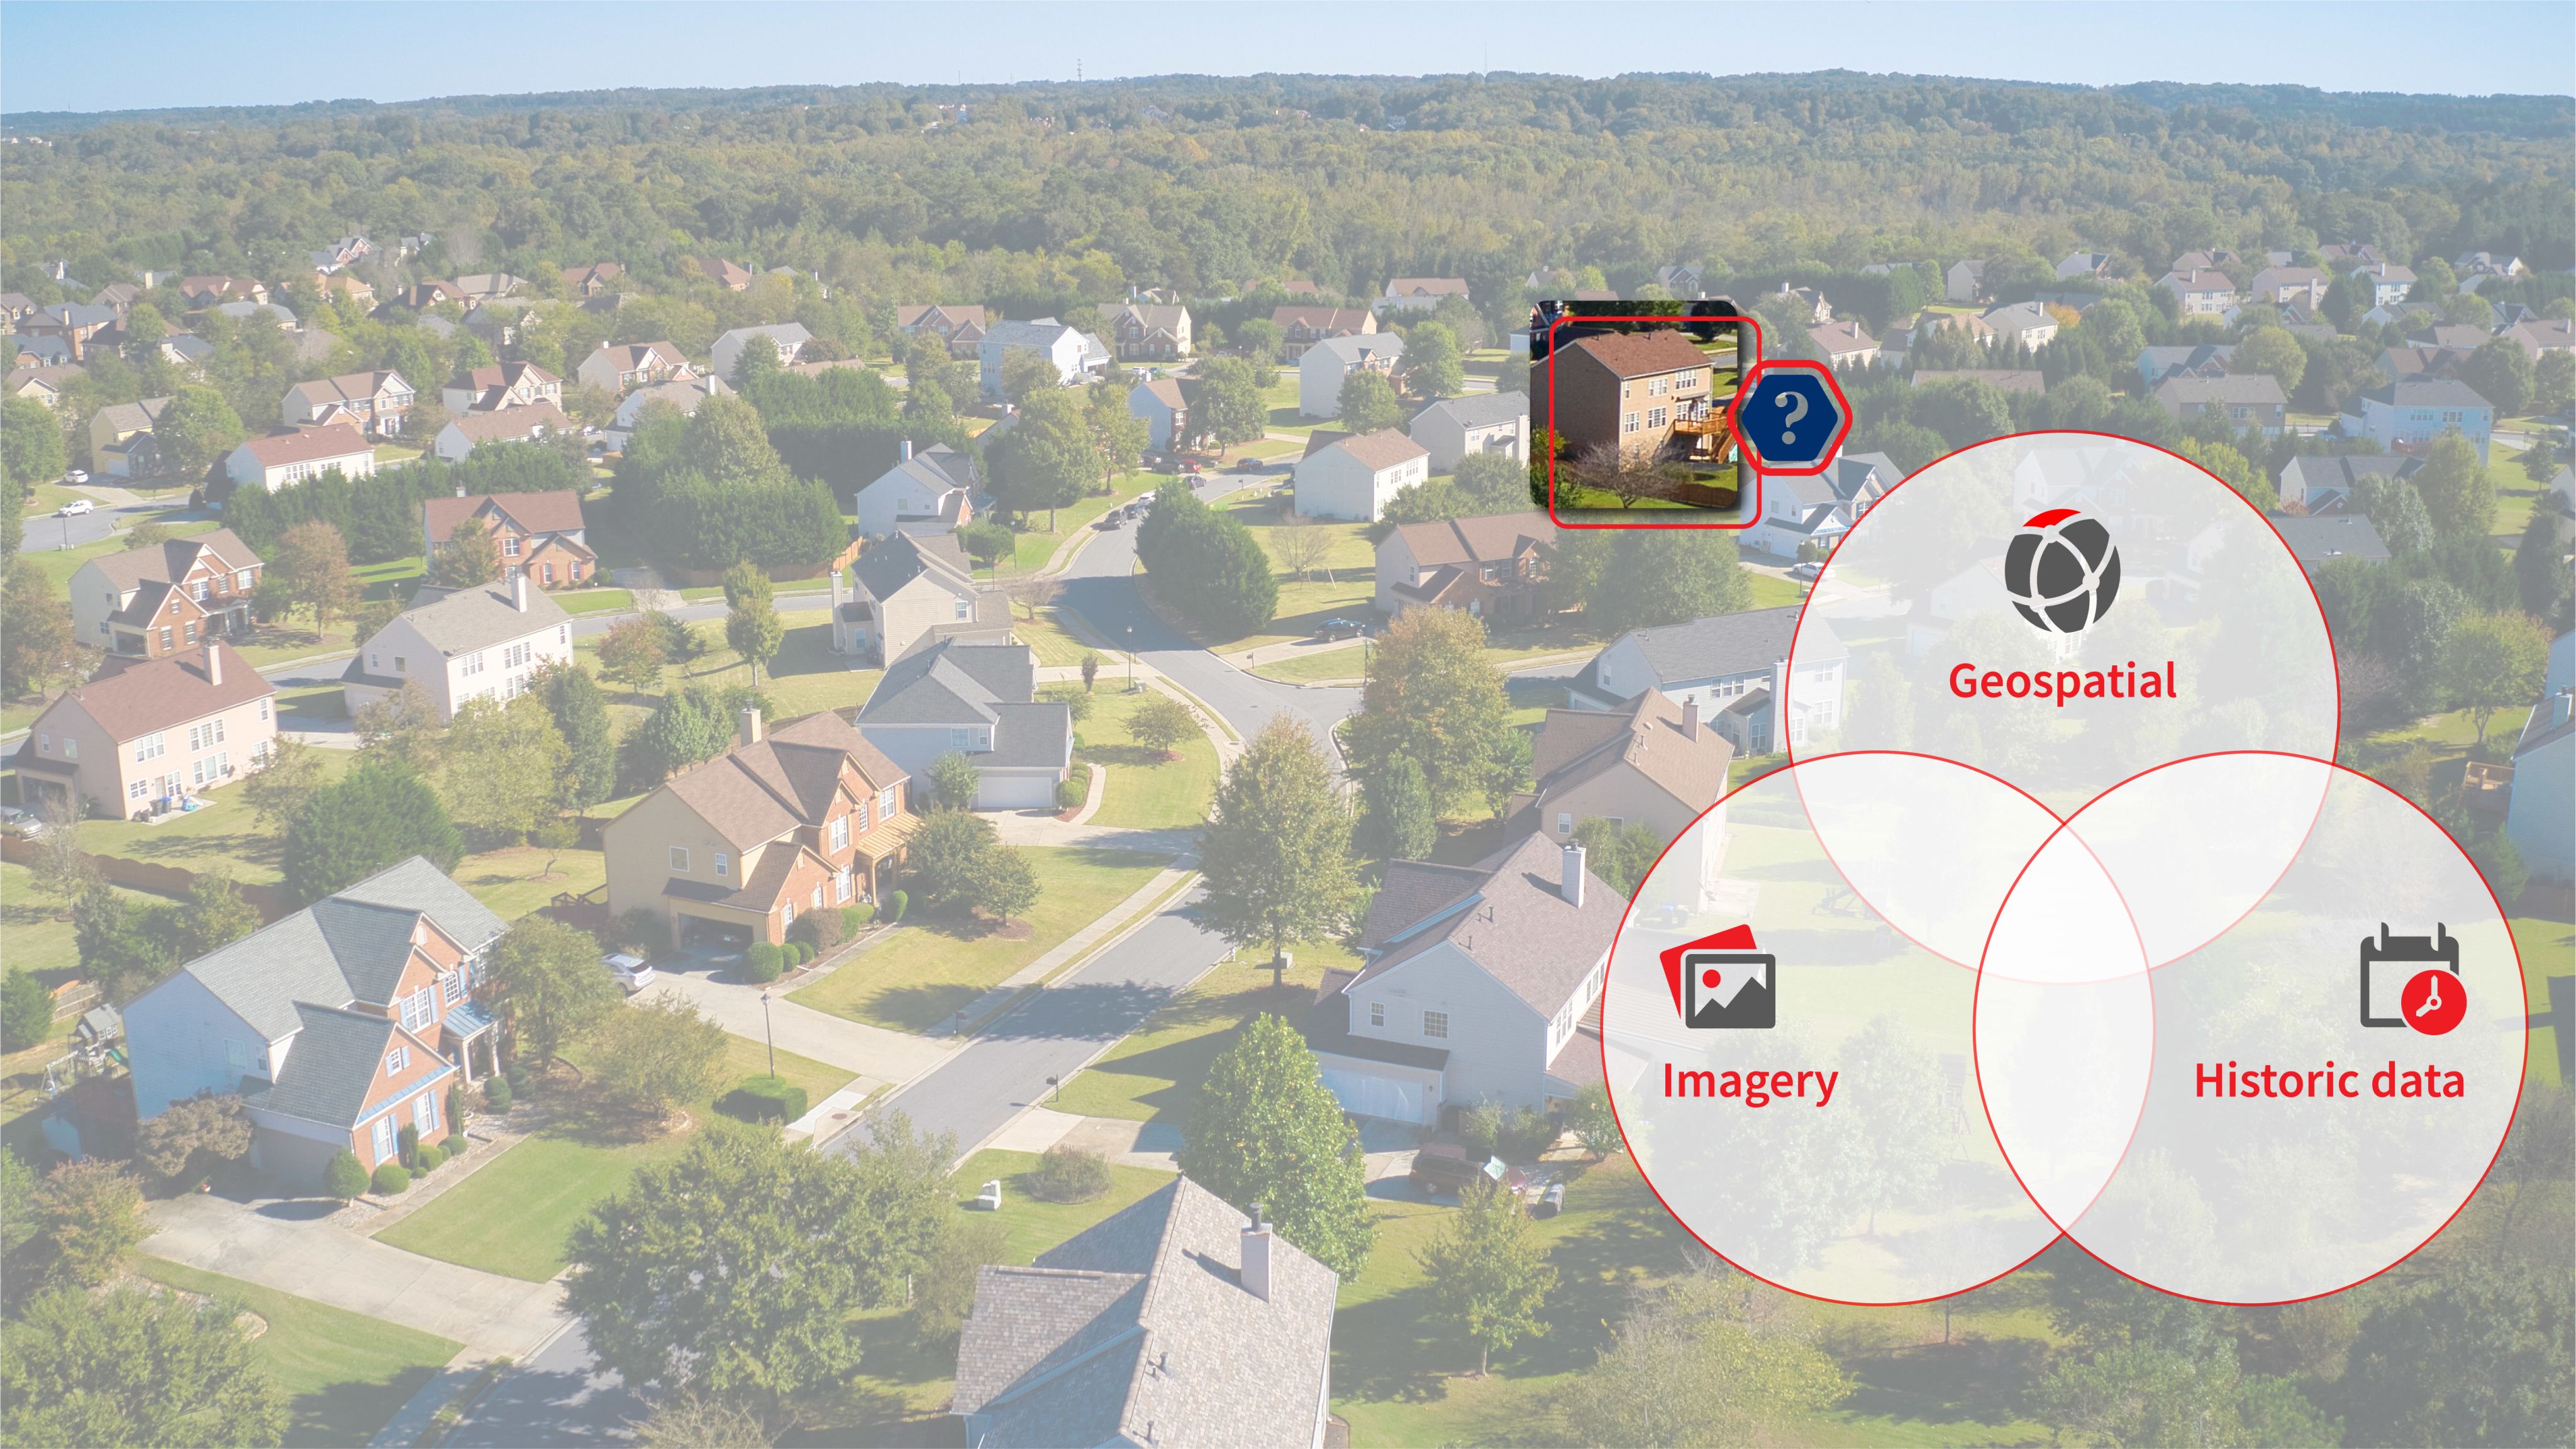
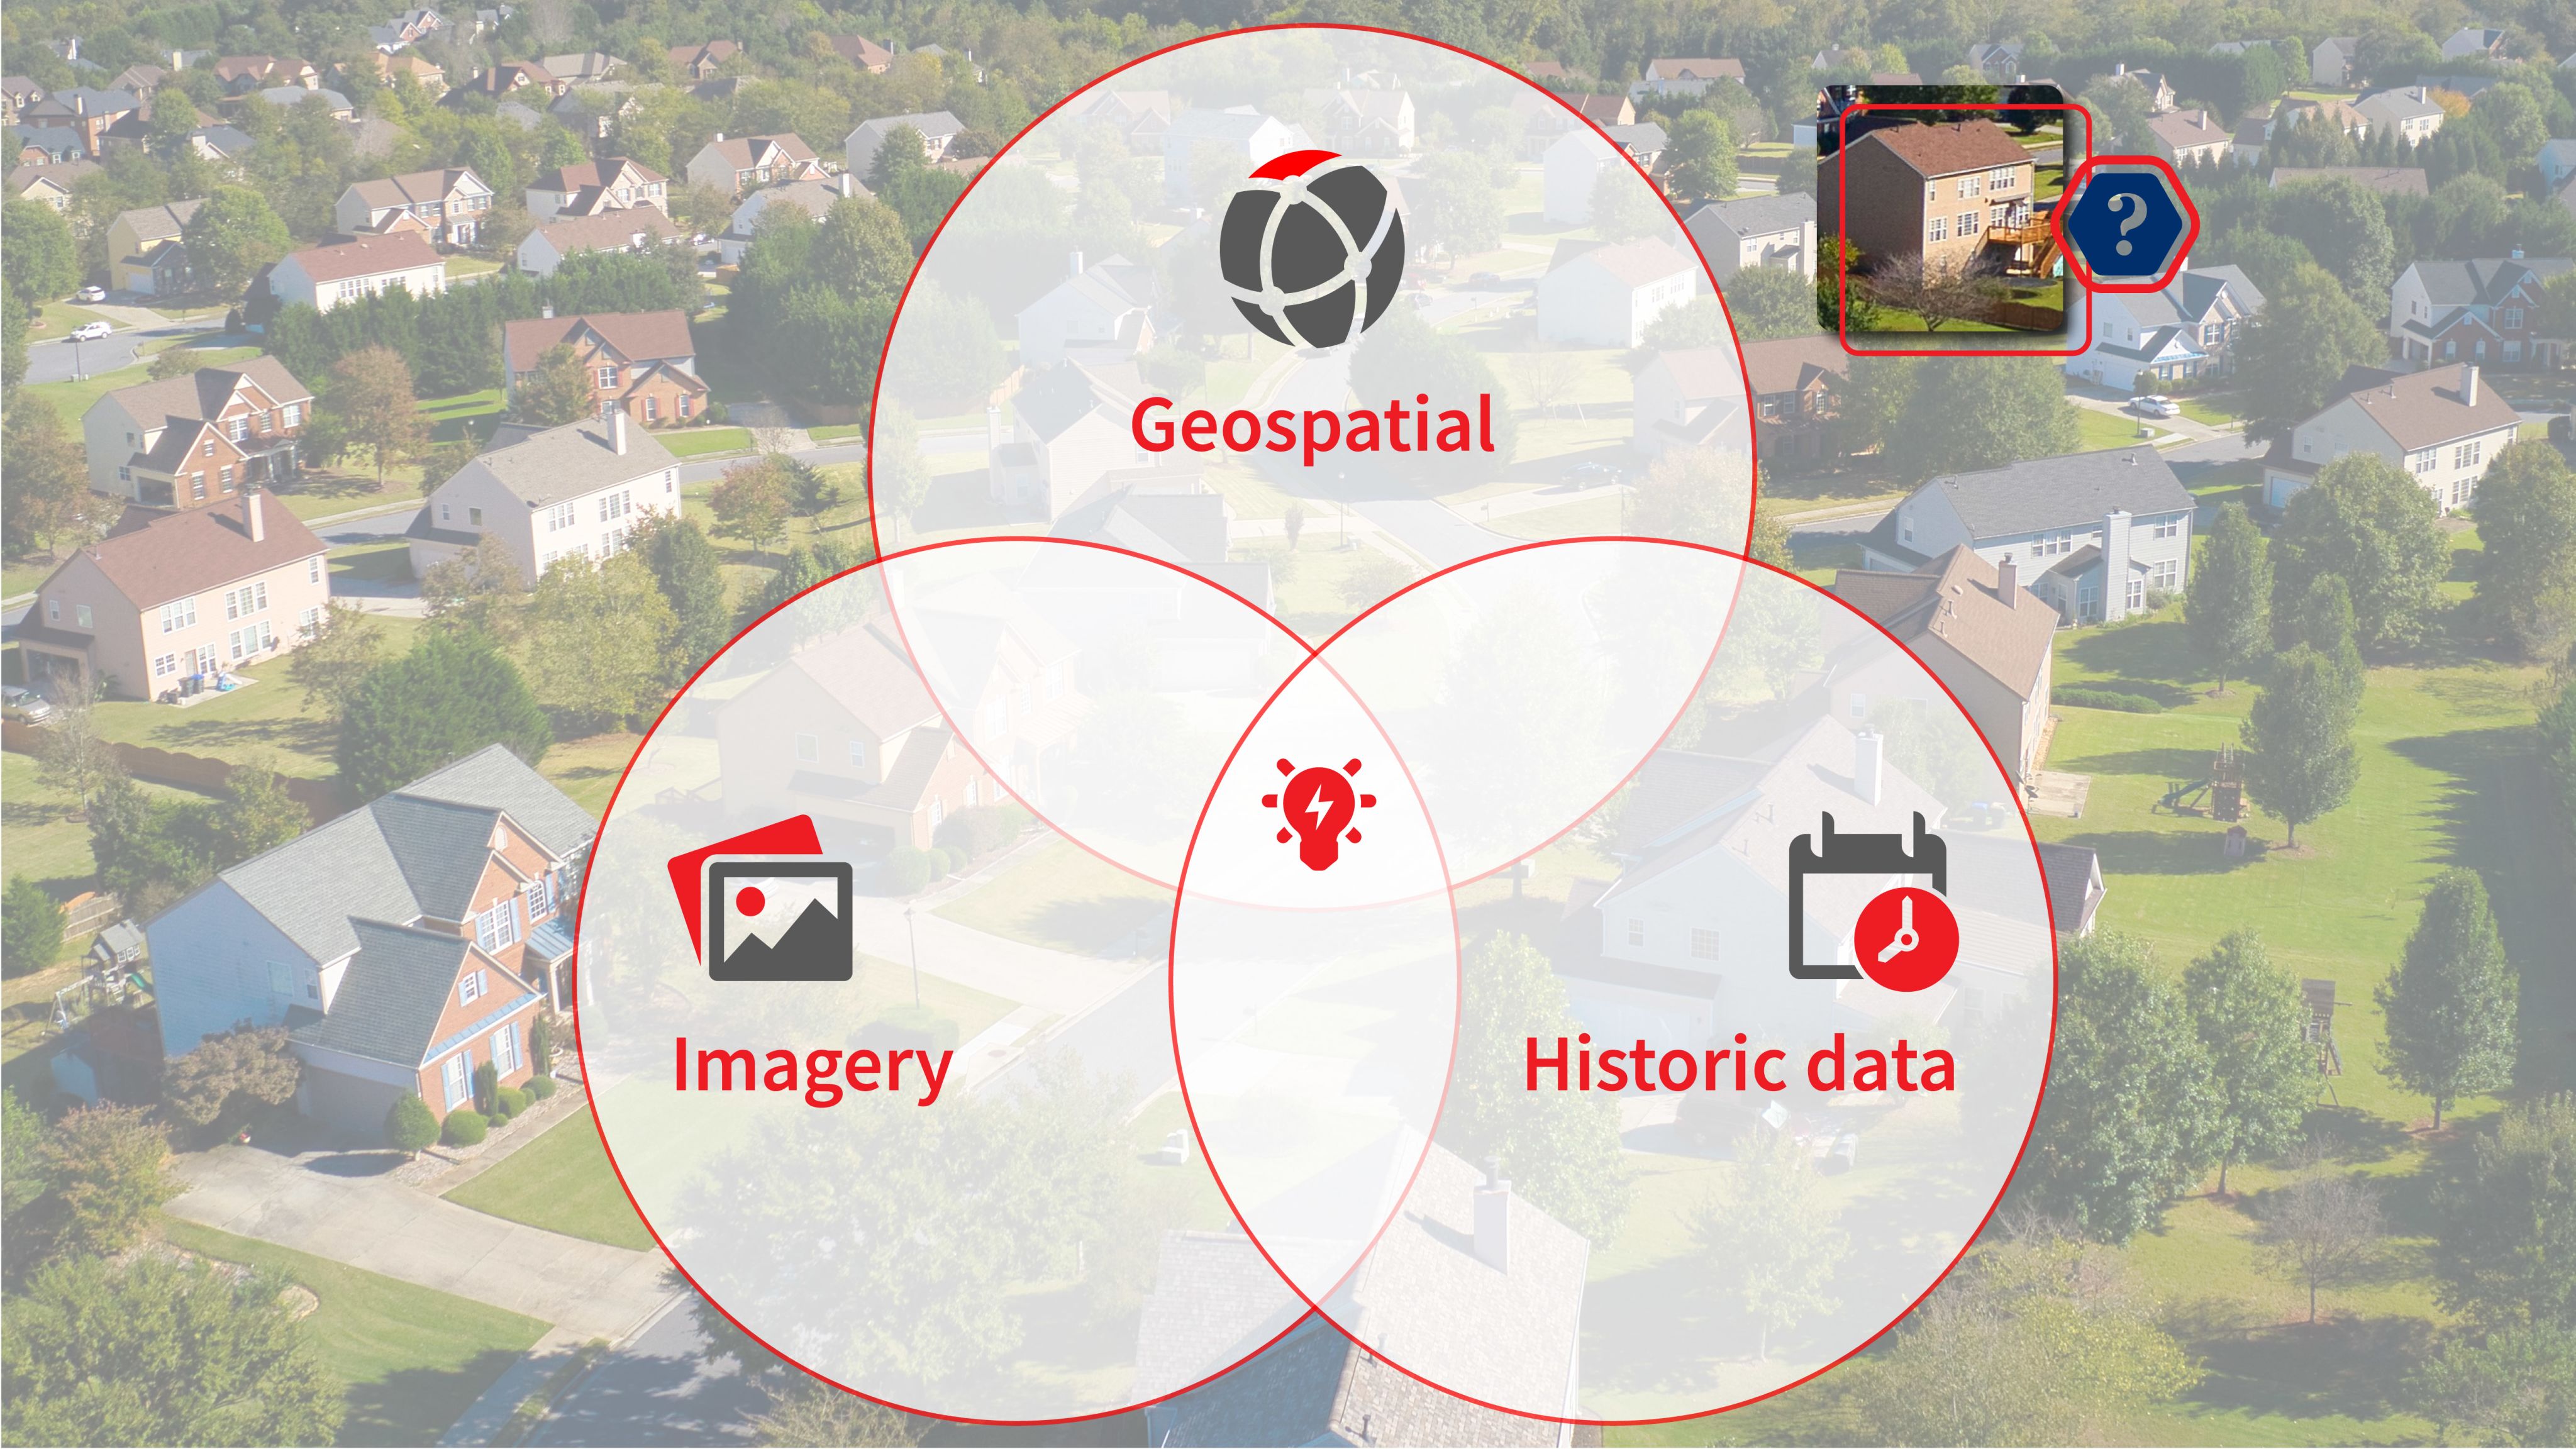
Handley identifies “the combination of three data sets… as the future of home insurance:” geospatial information, imagery of the interior and exterior of a site, and historic data that includes property and region-specific information.
The issue for most insurers is that they don’t individually have sufficient data to leverage the full potential of the tools. They therefore need to access a more comprehensive data set that aggregates property, location, market, and other information, such as that provided by LexisNexis Risk Solutions, as well as the analytics functionality that supports it.
“The amount of data you need to be statistically credible with your recommendations is bigger than any [one] insurance company’s data. There might be some micro areas where the insurance company has enough data to be assertive,” says Martin. “But really, a group like LexisNexis Risk Solutions serves a great role in gathering all that data and saying, ‘this is the real cost of insuring this house’.”
That aggregated information can be used in three key areas of the process: providing automation tools to deliver more efficient policy-building and claims-handling processes for agents and homeowners; delivering an improved understanding of a property’s risk for the purpose of pricing; and provision of information to lawmakers, builders, and homeowners to promote property resilience.
Leveraging data and technological advances
To respond effectively to intensifying climate risk, insurers must use data and the technology, in particular artificial intelligence, that can unlock the actionable insights the data provides. Those insights will allow insurers to assess risk better, to serve consumers more effectively, contain cost and margins, and enable better decision-making throughout the life cycle of insurance policy and property.
Handley identifies “the combination of three data sets… as the future of home insurance:” geospatial information, imagery of the interior and exterior of a site, and historic data that includes property and region-specific information.
The issue for most insurers is that they don’t individually have sufficient data to leverage the full potential of the tools. They therefore need to access a more comprehensive data set that aggregates property, location, market and other information, such as that provided by LexisNexis Risk Solutions Insurance business, as well as the analytics functionality that supports it.
“The amount of data you need to be statistically credible with your recommendations is bigger than any [one] insurance company’s data. There might be some micro areas where the insurance company has enough data to be assertive,” says Martin. “But really, a group like LexisNexis Risk Solutions serves a great role in gathering all that data and saying, ‘this is the real cost of insuring this house’.”
That aggregated information can be used in three key areas of the process: providing automation tools to deliver more efficient policy-building and claims-handling processes for agents and homeowners; delivering an improved understanding of a property’s risk for the purpose of pricing; and provision of information to lawmakers, builders and homeowners to promote property resilience.

Removing the pain points from policy and claims processes
Brian Keller, vice president of AI and data science for the Insurance business at LexisNexis Risk Solutions, believes the future of insurance is “touchless underwriting,” which removes most of the manual intervention in the process.
He envisages a world in which an applicant provides details of where they live and the insurer enables the homeowner to offer a comprehensive visual inspection of the property using advanced tools such as the company’s end-to-end property intelligence solution, LexisNexis® Total Property Understanding.9 This AI-enabled solution guides a property owner through a survey tool on their smartphone and assimilates their data insights into the carrier’s workflow, eliminating the need for an on-site visit.
“And after that, here’s your price! Click this link and now the policy’s in force,” Keller says. “Versus how long do you have to wait? How many conversations do you have to have? How much documentation do you have to provide?”
The result can reduce cycle times, costs for carriers, and hassle for property owners.
Automation can significantly reduce back-office tasks, such as the monitoring of renewal books, using policy data to track changes in coverage to ensure it is up-to-date and meeting the right standards.
1. https://risk.lexisnexis.com/insurance/total-property-understanding


Data insights fuel a better pricing process

Martin says that the industry effectively has two models on which to base its policies.
“The fundamental element of catastrophe pricing is what you assume the frequency and severity of events is going forward, and you can take a model view based on history, or a trended view that predicts a worse or better result,” he says.
Martin explains that utilizing trend models based on multiple data sources allows the industry to serve areas and customers it might not if based on history alone. He urges home insurers to move toward a system like that of the automotive industry. The Highway Loss Data Institute aggregates industry data to uncover patterns in safety and construction that can help to predict loss.
The tools and the data to do so are becoming available. Handley says their deployment will allow insurers to “balance the scales against some of the more extreme weather that we see.”
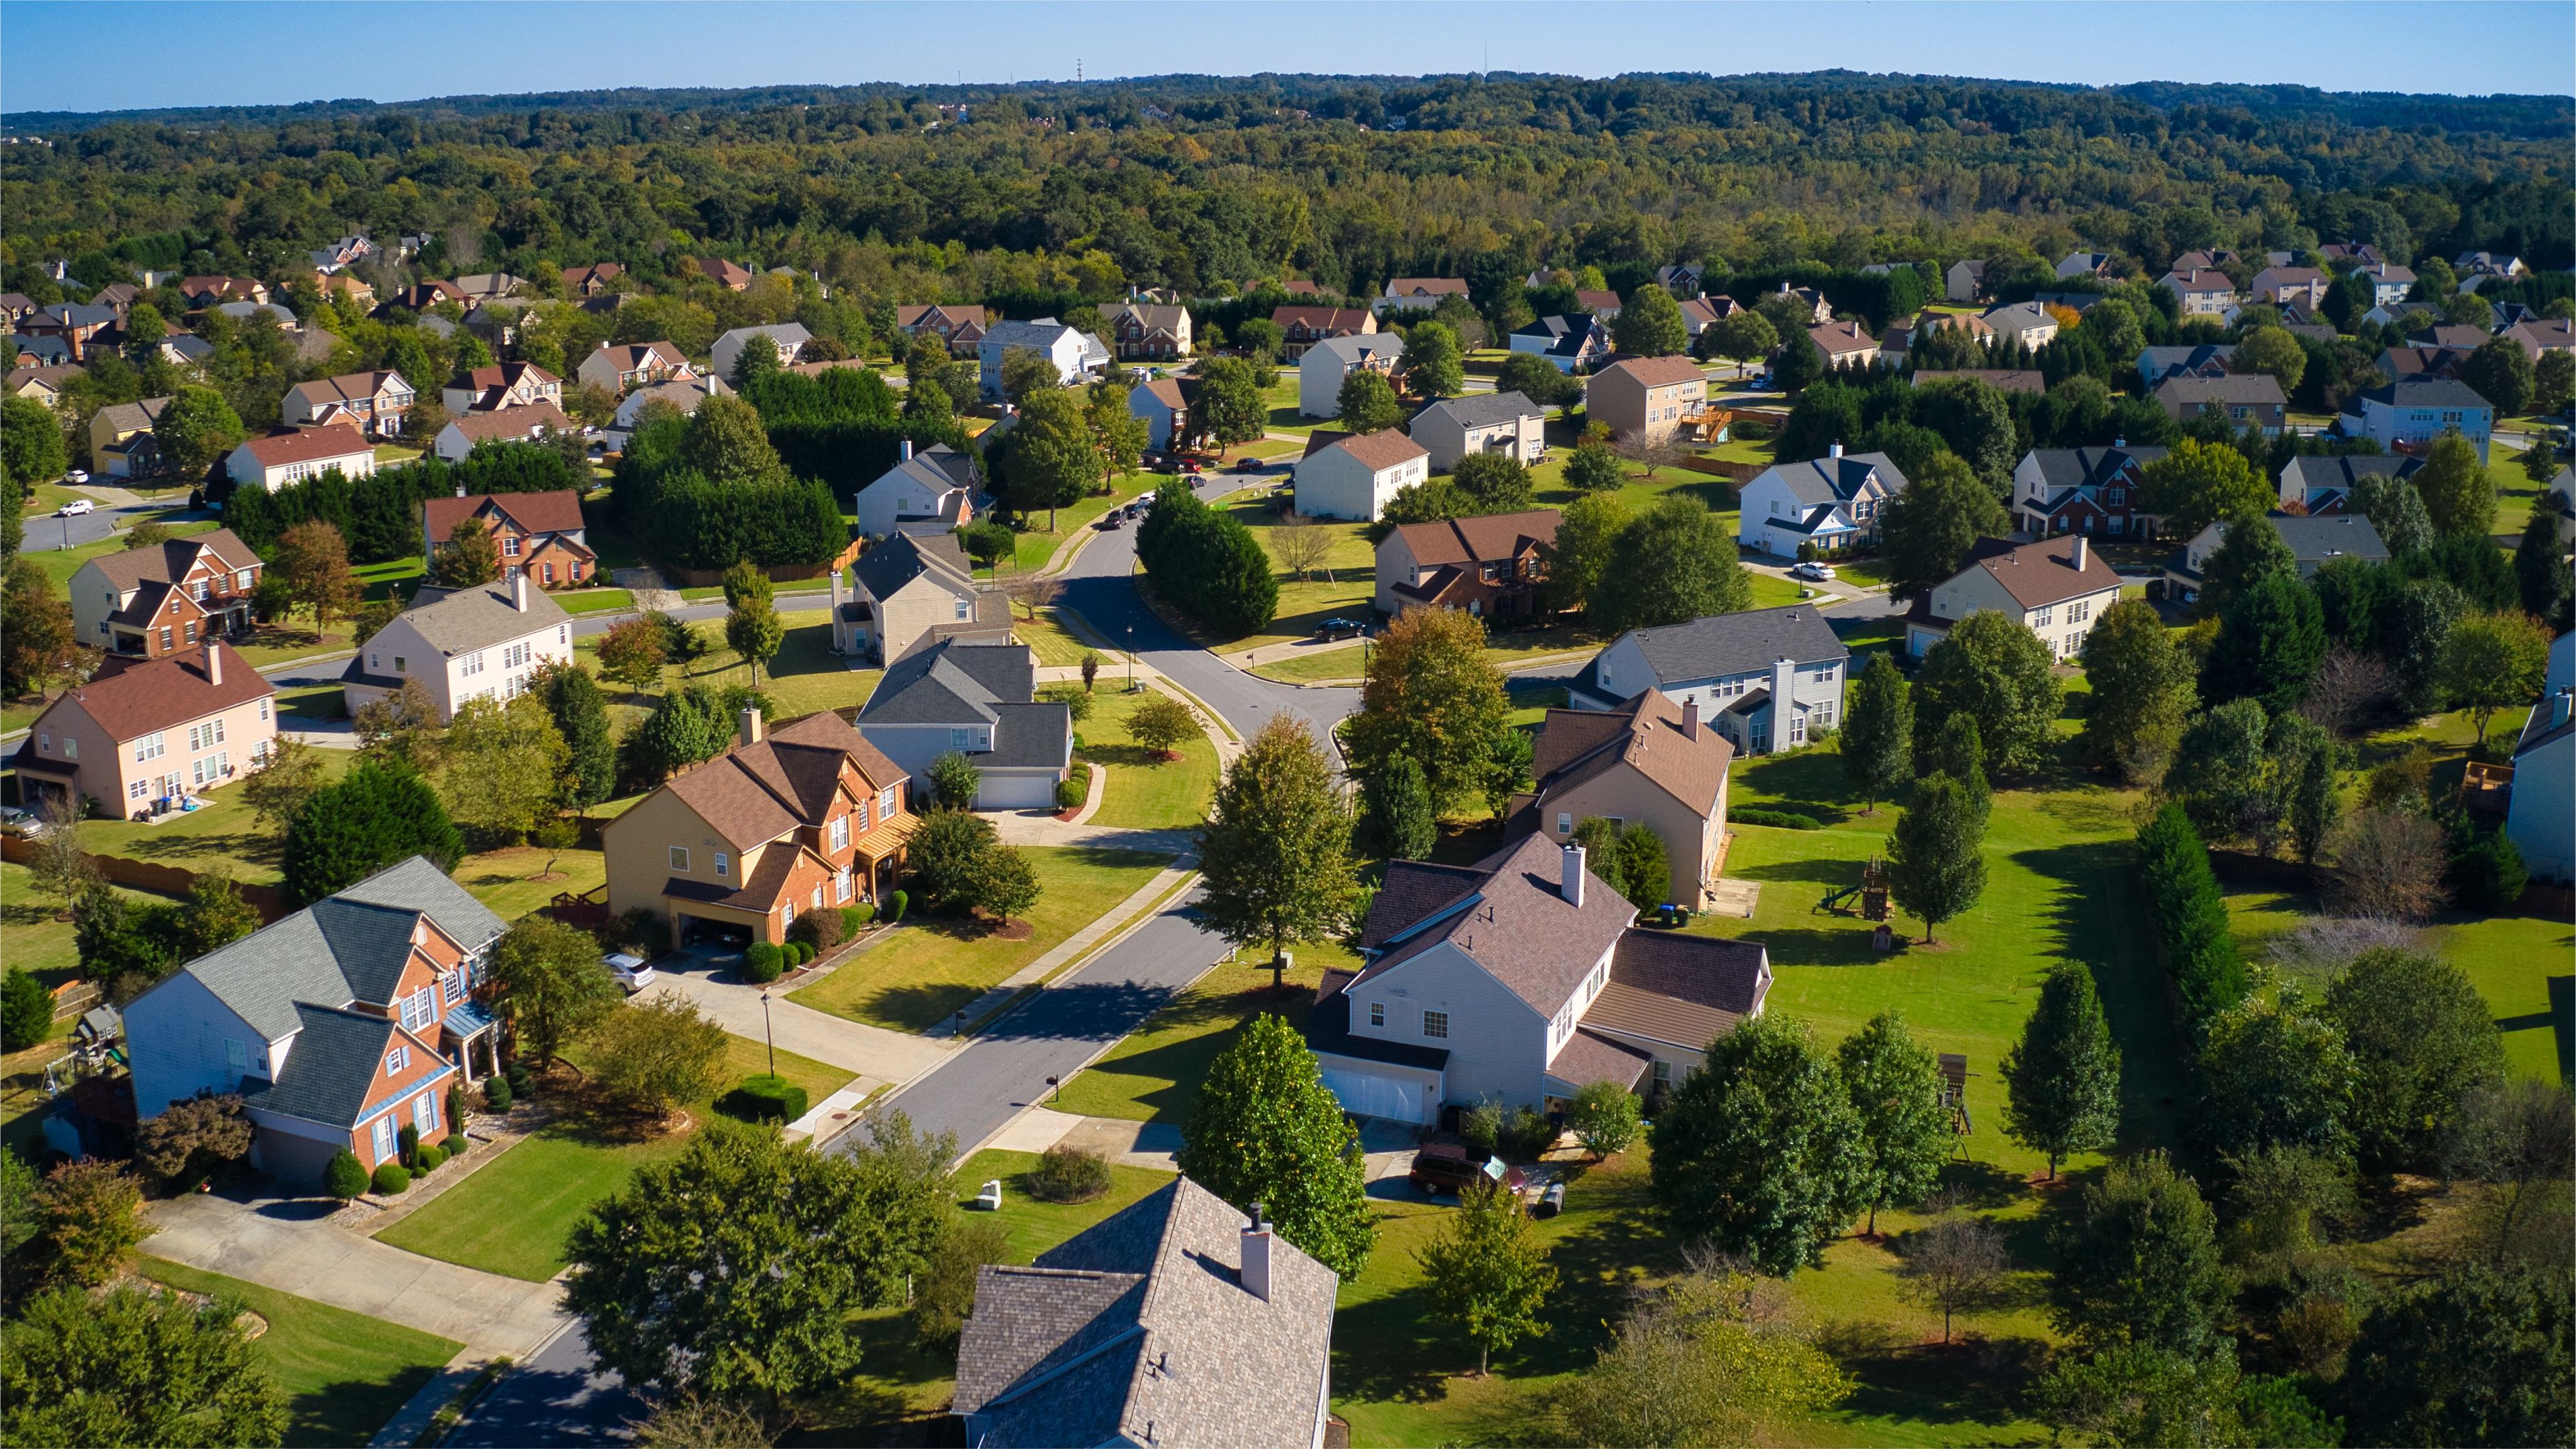
Aerial imaging, combined with automated analytical insight, is being used to determine the likelihood of a particular roof withstanding extreme weather. Interior shots, rarely a part of the current workflow, can identify potential issues with plumbing or electricity systems that may add risk. Geospatial information can provide vital information about a property’s likely susceptibility to flood, fire or storm damage. Meanwhile, aggregating comparative data – within the bounds of competition regulation – could help insurers benchmark performance in certain regions and understand and manage localized risk more effectively.
The result is that carriers have more data than ever to assess a property’s risk and price accordingly, and to deliver better information to homeowners to allow them to understand their situation. Equally, the data insights and predictive models can then determine ongoing risk with new inputs of information.
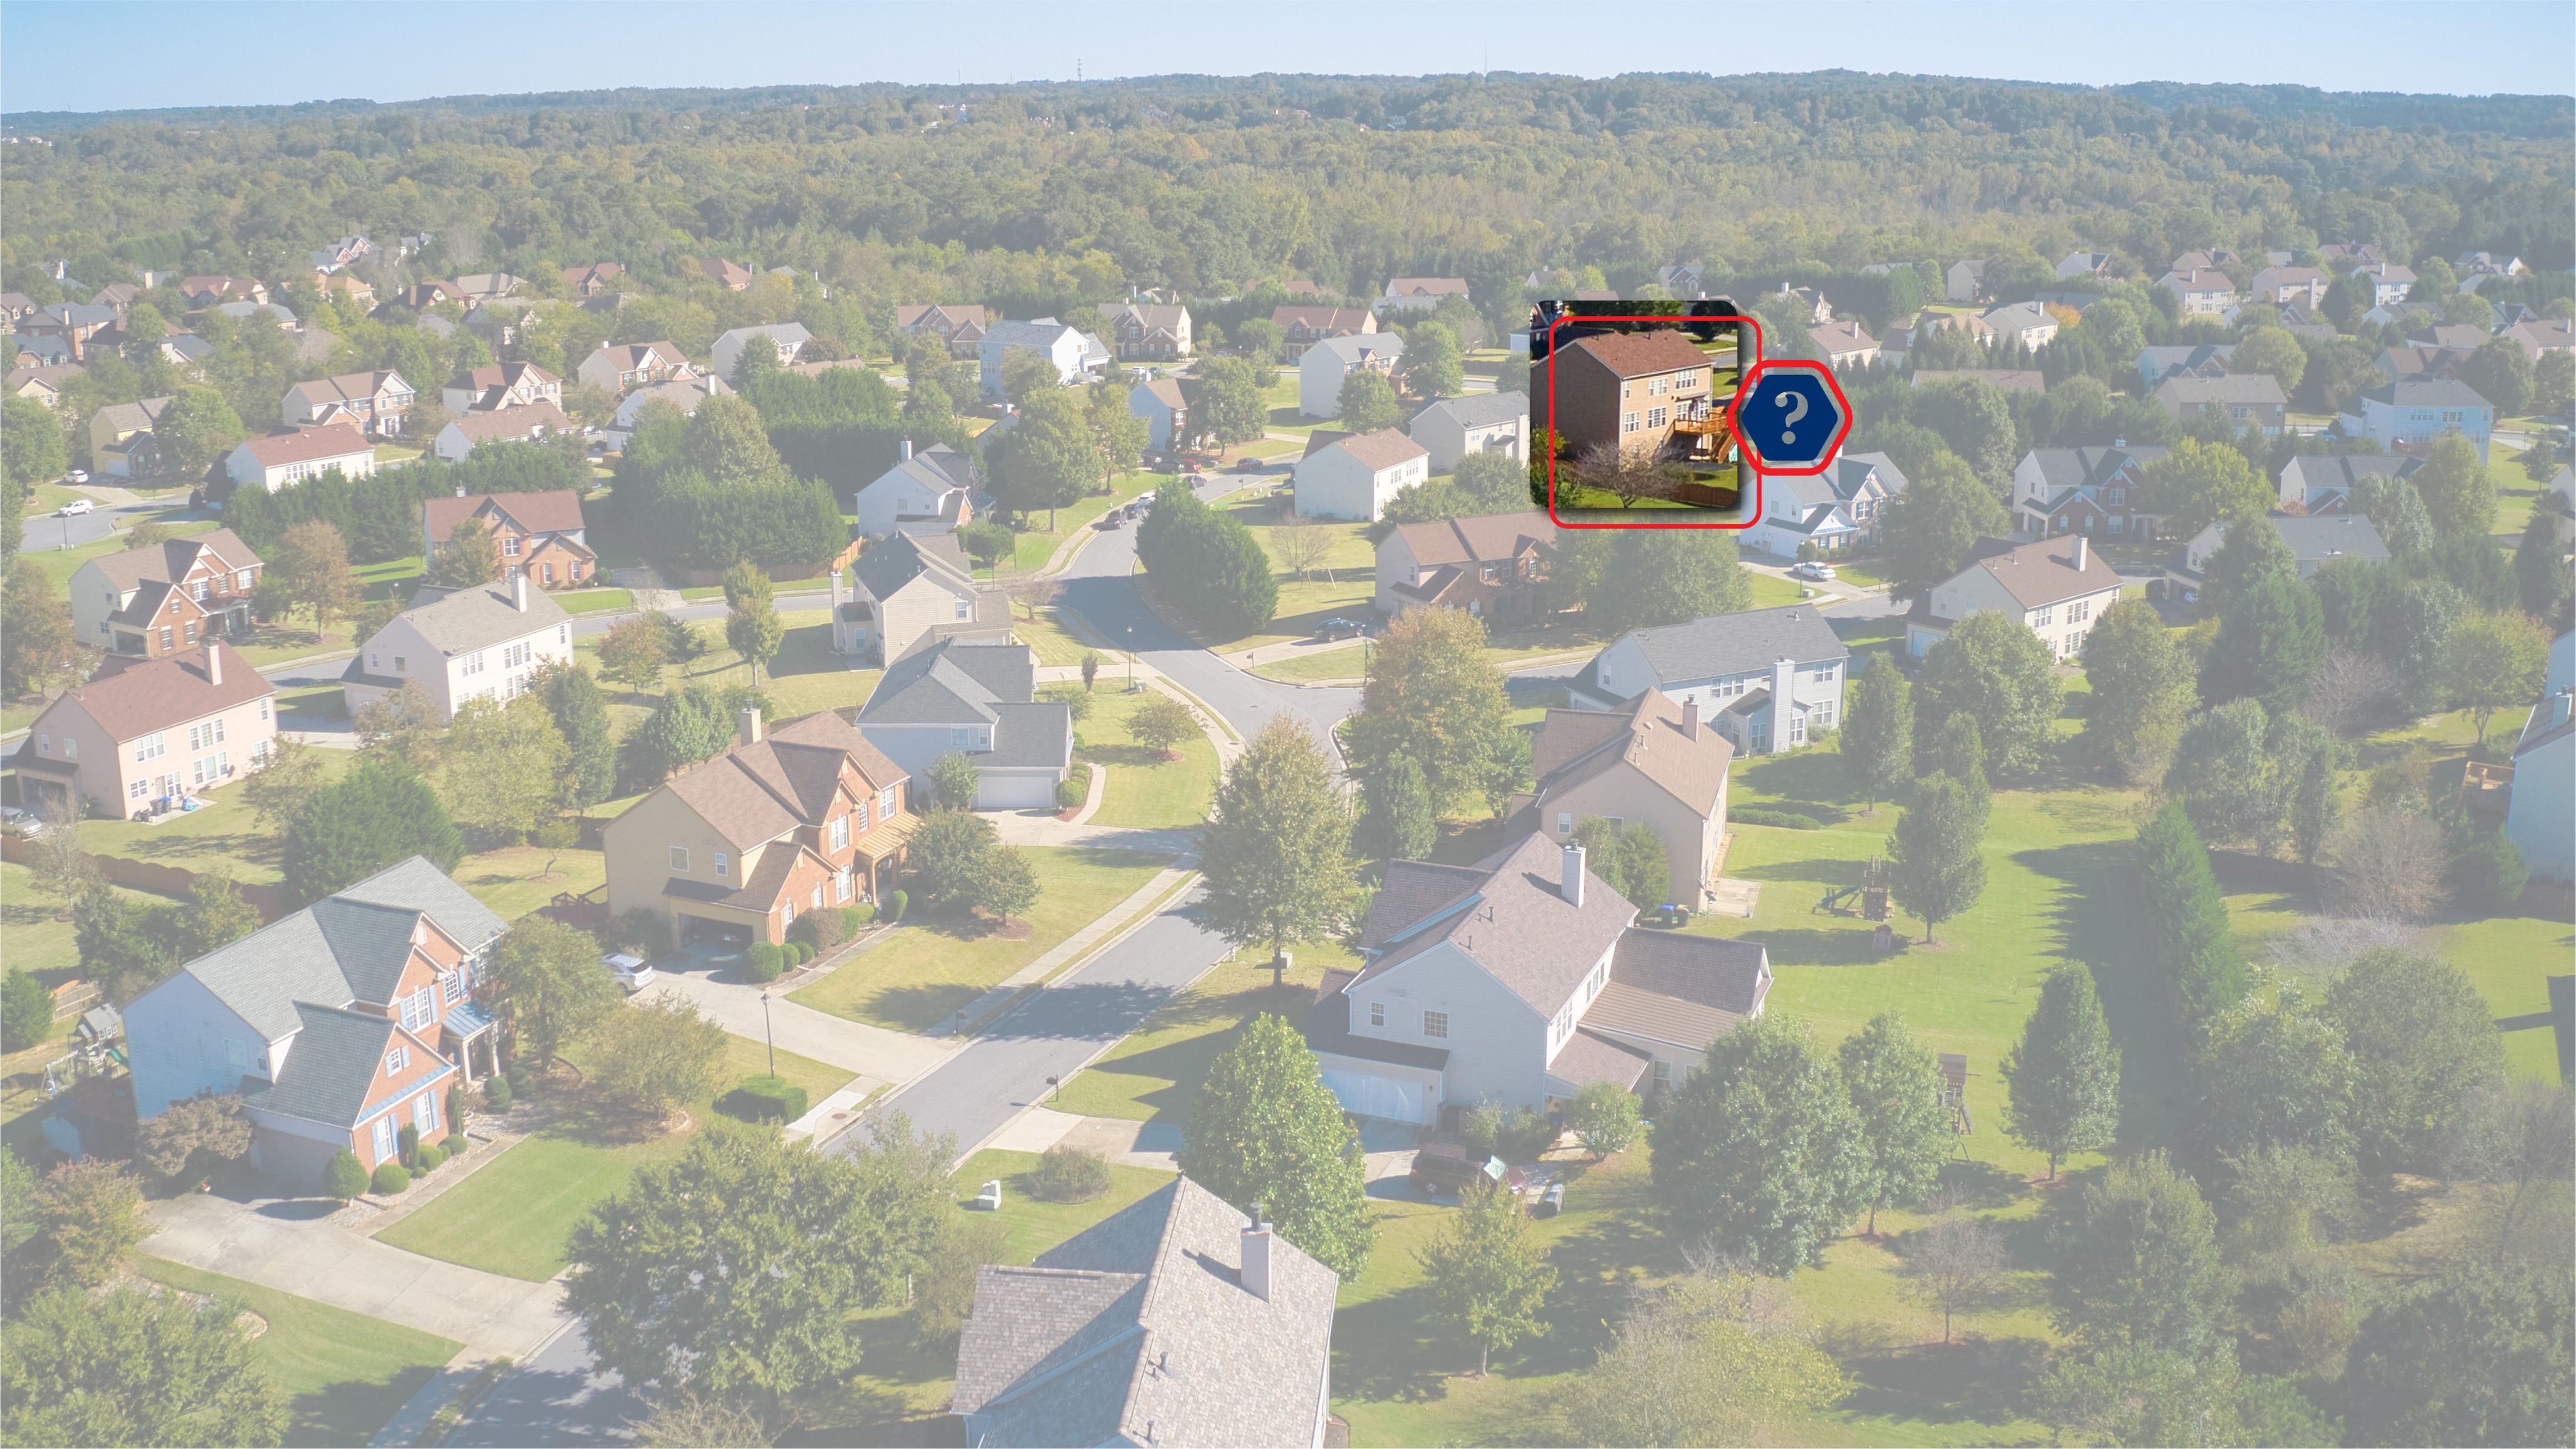
Handley says interpretation of the data provides insights that are sufficiently granular to deliver distinct quotes to houses on the same street.
“One house is at the end of the street and they’re rarely ever in the path [of a storm], but another house is on the other end of the street, and they always seem to be in the path. We can actually segment that risk accordingly, even at that level,” he says.
Similarly, the claims process can be made more accurate and efficient using both data gathered from aerial imagery that can assess damage, and weather tracking tools that can determine if a storm caused it.
“I reconstruct the weather conditions based on the available data to be able to say, yes, in this storm this particular house was likely impacted by severe hail or no, the storm missed a mile to the north,” says Megan Walker, a Florida-based forensic meteorologist and founder of Blue Skies Meteorological Services, which advises the insurance industry.


Using data to deliver resilient construction
Amelia Island, which sits on Florida’s northern Atlantic coast, is famous for its beaches, wildlife, and resorts. It is routinely subjected to evacuation orders during hurricane season and locals also worry about flooding from marshland. It typifies the situation of many growing coastal Florida communities. So far, it has been spared the direct hit Ian delivered to Fort Myers.
Martin invokes it as an example of how data can support better construction.
“Think about a house on Amelia Island that is close to the marsh. It’s been there 100 years… and it gets washed away. We come back and say the house needs to be built two feet or more likely 10 feet above the ground. It needs to be built with pilings that will not be worn away by saltwater intrusion. It needs to have concrete block construction and a roof that is very difficult to damage in high wind,” he says.
The availability of data to validate these conclusions is essential, he says, adding: “There should be a wave of people in Fort Myers right now studying the homes that made it through [Ian] and the ones that didn’t, and be able to discern between the two.”
Keller believes that building codes could be another source of data that can help manage risk: “I think it would be an interesting analysis to look at the loss by building code with perhaps a proxy of the year built and to show, if you are going into this space, your better risks are the ones built under more stringent building codes.”
Equally, that information can also be deployed by lawmakers and insurers to develop building codes that promote resilient construction in vulnerable areas, or to improve existing properties. Martin cites the example of North Carolina’s fortified roof program that provides financial incentives for homeowners to strengthen their defenses.10
10. https://fortifiedhome.org/incentives-north-carolina/
Finding an opportunity in the climate challenge
The scale of the challenge presented by climate-driven extreme weather cannot be exaggerated. Equally, however, the tools available to carriers present them with an opportunity to build a data-driven business model that is smart, sustainable, and can position them to serve their customers better – and in doing so gain market share.
The application of predictive analytics and AI solutions throughout their business can automate and streamline their operations while informing better decision-making that reduces risk and delivers intelligent pricing.
It also offers an opportunity for all stakeholders in the process to work together in leveraging insights to build resilient communities that can be served by a robust and competitive insurance industry. Everybody involved knows that the next Hurricane Ian may only be a matter of months away, and the more prepared they are for it, the better the outcomes will be for all.