What Do Electric Vehicles Mean for the Auto Insurance Industry?
At the turn of the last century, the internal combustion engine (ICE) revolutionized transportation, making personal mobility accessible to the masses and driving industrial growth. As automobiles became more widespread, so did the frequency and severity of automobile accidents.
Now, in the 21st century, we are witnessing a new transition—from ICE vehicles to electric vehicles (EVs)—as part of the broader shift toward renewable energy. Just as the transition from horse carriages to automobiles reshaped society, this shift presents new challenges and opportunities in infrastructure, regulation and risk management.
The transition from ICE vehicles to EVs brings a new set of driving risks, which have been actively assessed by the electric vehicle initiative within the Insurance business at LexisNexis® Risk Solutions. LexisNexis Risk Solutions is a leading provider of data and advanced analytics solutions for the insurance industry and is committed to helping insurers better understand the unique risks that EVs pose to their book of business.
Photo by Michael Fousert on Unsplash
Photo by Michael Fousert on Unsplash
Photo by Michael Fousert on Unsplash
Photo by Michael Fousert on Unsplash
Photo by Michael Fousert on Unsplash
Photo by Michael Fousert on Unsplash
Photo by Michael Fousert on Unsplash
Photo by Michael Fousert on Unsplash
Photo by Michael Fousert on Unsplash
Photo by Michael Fousert on Unsplash
Why do consumers prefer EVs?
With the powerful torque instantly delivered by their electric motors and all the latest technologies loaded onto the vehicles, many find EVs fun to drive. With the convenience of charging at home, the savings on energy costs, and fewer maintenance trips to dealerships, EVs can be appealing to own. Besides enjoying these practical benefits, some consumers have also become increasingly conscious of the environmental impact of burning fossil fuels, embracing a more environmentally friendly lifestyle and choosing EVs over traditional vehicles.
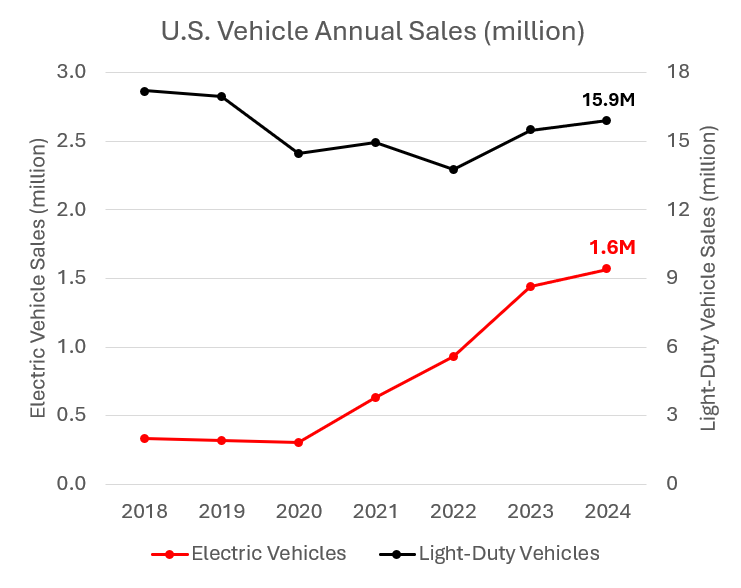
After robust sales growth in 2023 in the U.S. market, 2024 saw a much lower 2% year-over-year growth in ICE vehicle sales due to weaker consumer demand. The growth of EV sales has moderated along with it but still outperformed its ICE counterpart with a respectable 8.8% year-over-year growth.
This chart shows the annual sales volume of new vehicles since 2018. The black line is for Light-duty vehicles, which are cars, SUVs, and pick-up trucks that weigh 8,500 pounds or less. The red line is for electric vehicles (EVs), which include both battery electric vehicles (BEVs) and plug-in hybrid electric vehicles (PHEVs). This chart is created based on monthly vehicle sales data published by Argonne National Lab.

How do EV risks differ?
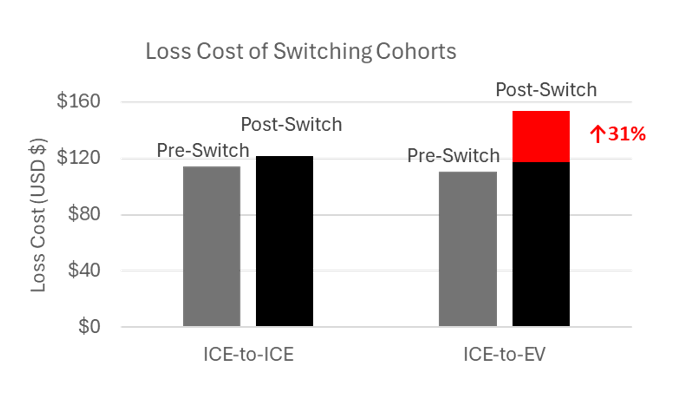
LexisNexis® Risk Solutions analysis found that U.S. consumers who replaced their old ICE vehicles with new EVs had incurred, on average, 31% higher auto insurance claims loss costs than those who replaced their old ICE vehicles with new ICE vehicles. These higher claims loss costs for EVs were driven equally by a 17% higher likelihood of accidents and a 17% higher cost of accident repairs. The higher claims costs for EVs were most often attributed under collision coverage, which covers physical damage to the insured EVs, rather than by bodily injury coverage, which has also contributed to the increase of auto insurance claims loss costs in recent years.
This chart compares the actual lost costs of new ICEs and EVs that were purchased between 2020 and 2022 to replace old ICEs. The grey bars represent the loss costs of old ICEs, the left black bar represents the loss cost of new replacement ICEs, and the red bar on top represents the additional actual loss cost of the replacement EVs above the expected loss cost, represented by the right black bar, the replacement vehicles are new ICEs. Insurance claims loss cost is the average claims amount paid per insured vehicle per coverage per year.
Why are EV risks higher than ICE risks?
EVs are constructed differently from ICE vehicles, contributing to higher claims loss costs and distinct driving experiences for EV owners. The distinct driving experiences of EVs take time for new EV drivers to adapt, introducing additional transition risk. Below are several factors that contribute to the higher cost of repairing EVs and higher likelihood of EV accidents that LexisNexis Risk Solutions examined.
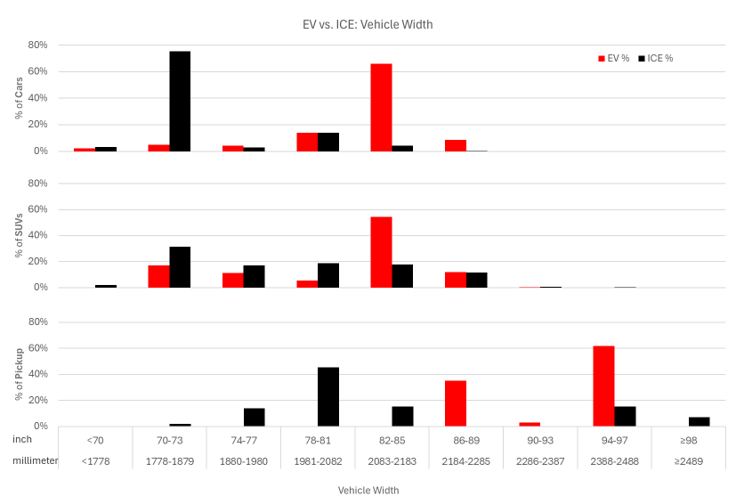
EVs sold in the U.S. market are generally heavier and more powerful than ICE vehicles. Across three major body types of vehicles: cars, SUVs and pickup trucks, EVs are also typically wider than their ICE counterparts.
This chart compares the distributions of vehicle width between ICE vehicles (represented by black bars) and EVs (represented by red bars). Across top (cars), middle (SUVs) and bottom (pickup trucks) charts, EVs width distribution skews toward right (wider) while ICEs width distribution skews toward left (narrower).
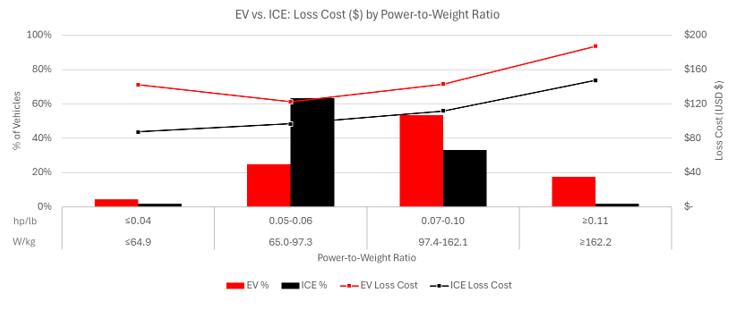
The maximum power a motor or an engine could deliver dictates how fast a vehicle could travel, particularly when adjusted for the different weight of the vehicles. In general, the higher the power-to-weight ratio, the higher the top speed and consequently the higher the insurance claims risk. LexisNexis Risk Solutions data revealed that EVs have higher claims loss costs than their ICE vehicle counterparts across the spectrum of power-to-weight ratios. Furthermore, there is a higher percentage of EVs at higher power-to-weight ratios than their ICE counterparts.
This chart compares the distributions of vehicles (left Y axis), as well as average loss costs (right Y axis), of ICEs vs. EVs, along the motor / engine power (horsepower) to vehicle weight (pounds) ratios (X axis). EVs loss costs (red line) are higher than ICE vehicle loss cost (black line) across the entire spectrum of power-to-weight ratios. EVs distribution (red bars) skews toward right (higher) while ICEs distribution (black bars) skews toward left (lower).
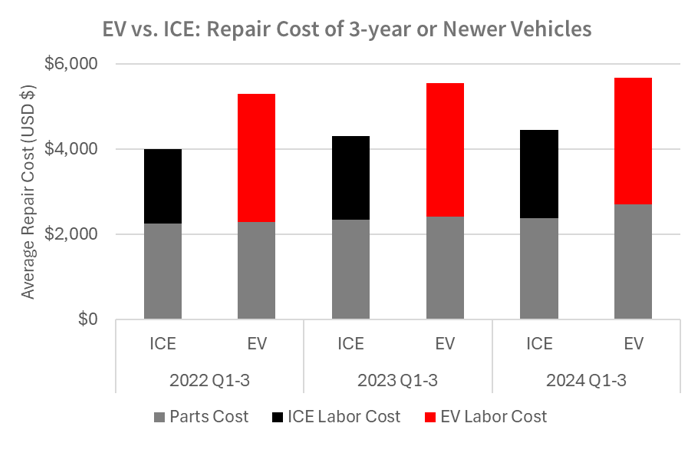
The meticulous procedures required for EV repairs often lead to more repair hours and consequently higher labor costs, according to the CCC 2024 Q4 Crash Course Report. Some EVs have repairability issues, such as requiring entire battery packs or body panels to be replaced for some minor damages, which in turn lead to higher parts and labor costs.
On a positive note, the average time between the last claims estimate and when vehicles leave repair shops has decreased in recent years. This improvement is due to repair shops becoming more familiar with EV platforms and legacy auto manufacturers expanding their market shares in the EV segment.
This chart is produced based on data published in CCC 2024 Q4 Crash Report. Higher repair cost (Y axis) of EVs is primarily due to higher labor costs associated with repairing EVs (red bars) vs. ICEs (black bars), rather than differences in parts cost (grey bars).

How are EV risks differentiated?
Not all EVs are created equal, and their insurance risks differ significantly as well. For example, the number of miles that an EV could travel with a full charge, also known as the electric range of an EV, is highly correlated with the use of the EV and the exposure of the EV to road hazards.
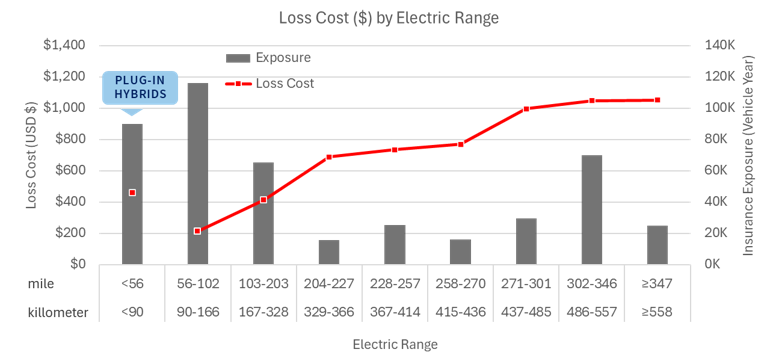
As expected, LexisNexis Risk Solutions research has shown that the higher the electric range, the higher the claims loss cost of the EV. Plug-in hybrid EVs (PHEVs) are exceptions. Despite having electrical ranges typically of 50 miles or less, PHEVs can travel further with their built-in gas engines, which leads to higher claims loss costs.
This chart shows the correlation between loss cost (left Y axis) of EVs’ Collision coverage and their electric ranges (X axis). Except for the leftmost data point, EV loss cost (red line) increases along with the electric range. Part of the EVs represented by the leftmost loss cost data point (the red dot) are plug-in hybrid EVs. The distribution of EVs is represented as insurance exposure (black bars) across their electric ranges. Insurance exposure (right Y axis) is the sum of the product of the number of vehicles multiplied by the duration of their insurance coverage.
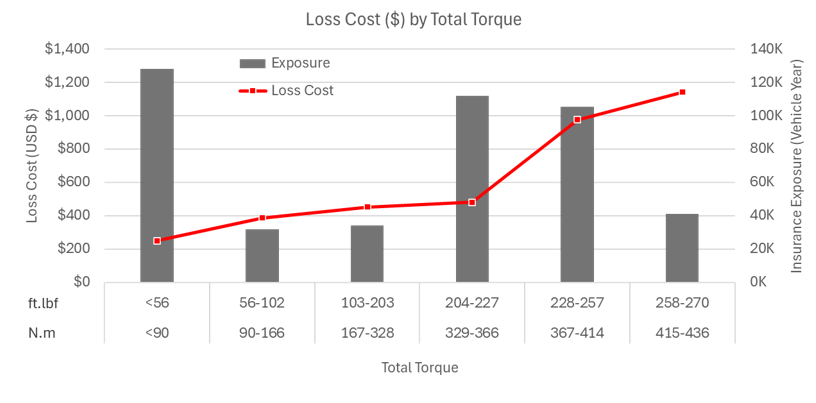
It takes time for new EV drivers to adapt to the distinctive driving experiences of EVs. EVs accelerate much faster from stand still, as the maximum torques of the powerful electric motors are delivered instantly the moment a driver steps onto the drive pedal. In contrast, ICE vehicles need to wait for their engines to rev up to reach maximum torque. The extra weight of EVs, primarily from their battery packs, makes slowing the vehicle down more difficult, resulting in longer braking distances.
Most EVs implement regenerative braking, which converts kinetic energy of the vehicle into electricity during braking to extend driving range. However, some implementations of regenerative braking slows abruptly when the driver releases the pedal, often surprising following vehicles and increasing the risk of rear-end collisions. Data from LexisNexis Risk Solutions reveals significant learning curves for new EV drivers adapting to these distinctive driving experiences. Further analysis is underway to better understand how these learning curves vary among different drivers and vehicle types.
This chart shows the correlation between loss cost (left Y axis) of EVs’ Collision coverage and the total torque of their electric motors (X axis). EV loss cost (red line) increases along with the total torque. The distribution of EVs is represented as insurance exposure (black bars) across their total torque. Insurance exposure (right Y axis) is the sum of the product of the number of vehicles multiplied by the duration of their insurance coverage.
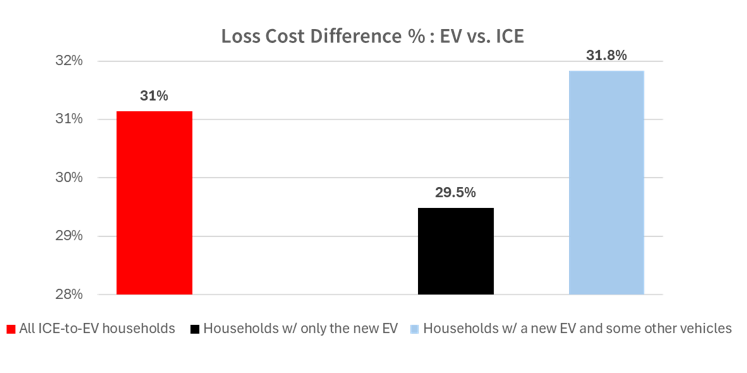
The increased likelihood of claims, partly due to the learning curves that new EV drivers go through, presents an opportunity for insurers to collaborate with these drivers to reduce the accident risk. Establishing educational programs to inform drivers about the differences of the EV driving experiences and safe driving tips for EVs can be helpful. For example, in households that have both EVs and ICE vehicles, drivers should stick to their own car type. Switching between EVs and ICE vehicles can slow the learning process and increase claims risk for EVs.
This chart shows the differences in EV loss cost between households newly switched to a new EV without any other vehicles and households newly to a new EV but also own other vehicles (most likely ICE vehicles), comparing to those similar households switched to new ICEs. Mixed driving of EVs and ICEs is RISKIER as it slows down new drivers' adapting to EVs and causes confusion in emergencies.
Conclusion
It took 50 years to transition from horse carriages to ICE vehicles. The transition from ICE vehicles to EVs will likely take decades as well. The increased claims risk during this transition will persist until most drivers adapt to EVs. It is critical for auto insurers to act now: to understand the distinctive risk profiles of EVs, incorporate these insights into their rating and underwriting workflows, and iterate and refine while the cost of making mistakes and learning is still low.
Photo by Hyundai Motor Group on Unsplash
Photo by Hyundai Motor Group on Unsplash


